
- Quick take
- Who this guide is for
- What is economic diversity?
- How economic diversity is measured
- The 2026 global picture
- The concentration paradox: the benchmark itself is narrowing
- Climate exposure is now a diversification variable
- Economic diversification as climate adaptation
- Why economic diversity affects hiring, wages and workforce planning
- How to measure economic diversity in your own market
- Frequently asked questions
Quick take
Economic diversity is the degree to which an economy spreads its activity across many sectors instead of leaning on a few. It is measured against a national or global benchmark, and on the most widely used relative indices a lower score means more diverse, not less. The 2026 picture carries an awkward twist: the economies used as the diversification benchmark are themselves concentrating. In the United States, healthcare and social assistance accounted for 123,000 of the 130,000 jobs added in January 2026, and eleven industries contracted over the year. Meanwhile, Europe’s 2026 heat summer showed that the sector mix now carries climate risk as well as market risk, erasing roughly a full percentage point of EU GDP.
Who this guide is for
Economic diversity is a different question depending on which chair you sit in, so this guide is written to be read in sections rather than end to end.
• Workforce planners and talent acquisition leads choosing where to open a hub, or judging whether a market can absorb a hiring push without wage escalation.
• Economic development and investment promotion teams benchmarking a region and building the evidence case for diversification funding.
• Investors and analysts treating sector concentration as a risk signal alongside the usual macro indicators.
• Site selection consultants who need a defensible concentration score rather than a narrative.
• Policy researchers tracking how diversification interacts with climate adaptation and digital trade.
• Individuals relocating without a job offer who want to know whether a city has enough sectoral breadth to absorb a bad quarter.
If what brought you here is socioeconomic diversity — the distribution of income, education and wealth across a population — that is a genuinely different measure built on different data. The section below explains the distinction, and the FAQ returns to it.
What is economic diversity?
Economic diversity is the degree to which a country, region or metropolitan area spreads its employment and output across a broad mix of industries rather than depending on a small number of them.
An economy built on crude oil extraction has low economic diversity. An economy where healthcare, logistics, advanced manufacturing, finance, agriculture, and professional services each carry meaningful weight has high economic diversity. The practical consequence is shock absorption. When one sector contracts, a diverse economy still has others hiring, and displaced workers have somewhere to go. When a concentrated economy loses its anchor sector, there is no internal cushion.
The international policy framing adds a second dimension. The UNFCCC describes economic diversification as the process of shifting an economy away from a single income source toward multiple sources across a growing range of sectors and markets, and notes that in the context of climate adaptation it takes on new relevance as a way to move away from vulnerable products, markets, and jobs toward income sources that are lower-emission and more climate resilient. Diversification, in other words, is no longer only an economic growth strategy. It is a resilience strategy.
Economic diversity, economic diversification, and a diverse economy
These three phrases are used interchangeably in most search results, and they should not be.
| Term | What it actually refers to | Correct use |
| Economic diversity | The current state of an economy’s sector mix, at a point in time | “Germany has high economic diversity” |
| Economic diversification | The deliberate process of broadening that mix through policy or investment | “The state funded economic diversification into biotech” |
| A diverse economy | The descriptive outcome of successful diversification | “Malaysia has built a diverse economy relative to its commodity peers” |
Table 1. The three terms are not synonyms. One is a measurement, one is a process, one is a description.
What economic diversity is not
Economic diversity in this sense is about sector mix. It is not about demographics. Socioeconomic diversity — the spread of income, educational attainment and wealth across a population — is a separate measure, built from household survey data rather than industry employment data, and answering a different question.
Both matter. They are not the same index, and a page that merges them will produce the wrong answer to both. The confusion is common enough that a single search results page for this term will typically return regional diversification research, university socioeconomic admissions data, and commentary on representation within the economics profession, all mixed together.
Why the distinction matters in practice
If you are building a model, the two measures pull from incompatible sources. Sector diversity comes from industry employment or output classified under a standard taxonomy such as NAICS or ISIC. Socioeconomic diversity comes from income distribution, educational attainment, and occupational class. Mixing them produces an index that cannot be validated against anything.

How economic diversity is measured
Four approaches dominate the literature, and they do not all read in the same direction. Getting the direction wrong is the single most common error in published explanations of this topic.
The Herfindahl-Hirschman Index
Take every industry’s share of total employment or output, square each share, and sum the results. An economy where one industry holds eighty percent of employment produces a far higher HHI than one where five industries hold twenty percent each. The measure is borrowed from antitrust analysis of market concentration and travels well to regional economics. A higher HHI means more concentrated, which means less economic diversity.
The Shannon-Weaver entropy index
Borrowed from information theory, this measures the entropy across sector shares. It rewards both the number of sectors present and the evenness of their distribution. Here, a higher score means more diverse, the opposite direction to HHI.
Relative diversity indices
Both measures above assume that perfect diversity means every sector is equally sized, which no real economy achieves. Relative indices solve this by benchmarking a region against a reference economy rather than against a theoretical ideal. The reference is normally the national economy, which is assigned a score of zero as the most diversified point of comparison. A region scoring close to zero resembles the national sector mix and is therefore relatively diverse. A high score means it does not resemble it, and is concentrated.
The Global Economic Diversification Index
At country level, the most comprehensive current measure is the Global Economic Diversification Index, published in February 2026 by the Mohammed bin Rashid School of Government in partnership with the World Governments Summit. The 2026 edition measures economic diversification across 115 countries over a 23-year span, which makes it one of the few datasets long enough to separate structural diversification from cyclical noise.
Reading the score in the right direction
Before citing any diversification figure, establish which family of index it belongs to. The three read differently, and a reversed interpretation will invert your conclusion entirely.
| Method | What it computes | Direction | Best used for |
| Herfindahl-Hirschman Index | Sum of squared sector shares | Higher = less diverse | Quick internal concentration checks |
| Shannon-Weaver entropy | Information entropy across sector shares | Higher = more diverse | Academic and comparative research |
| Relative diversity index | Distance from a benchmark economy’s sector mix | Higher = less diverse; benchmark = 0.00 | Regional and metro-level benchmarking |
| Global Economic Diversification Index | Composite of trade, output and revenue sub-indices | Higher rank = more diversified | Country-level and cross-border comparison |
Table 2. Four measurement families, three different directions of travel. Check which one a source is using before comparing figures across studies.
The 2026 global picture
Three findings from the 2026 index are worth carrying into any analysis this year.
Who leads, and who is catching up
The United States, China and Germany continue to hold the top three positions as the world’s most diversified economies. Among commodity-dependent nations, Mexico and Malaysia retain their leading positions, demonstrating that resource endowment is not destiny. Saudi Arabia, the United Arab Emirates and Qatar have all demonstrated significant progress since 2000, which the index attributes to sustained policy reform rather than to commodity price cycles.
| Grouping | 2026 finding | What it demonstrates |
| Most diversified overall | United States, China, Germany hold the top three positions | Scale plus industrial breadth continues to define the frontier |
| Commodity-dependent leaders | Mexico and Malaysia retain leading positions in their group | Resource dependence can be structurally reduced |
| Fastest sustained progress | Saudi Arabia, the UAE and Qatar since 2000 | Policy reform, not price cycles, drives durable change |
| Persistent laggards | Lower-income nations struggling to return to pre-pandemic levels | Digital infrastructure investment is now a gating factor |
Table 3. Headline groupings from the Global Economic Diversification Index 2026, which covers 115 countries across 23 years.
Digital trade has become a diversification channel
The 2026 edition builds on the EDI+ extension, which incorporates digital indicators into the trade sub-index in order to capture how digital transformation affects diversification. The finding is that digital trade is accelerating diversification across many emerging economies, giving them a route into new export categories that does not require building heavy physical infrastructure first.
The corollary is less encouraging. Disparities persist, and lower-income nations are struggling to return to pre-pandemic levels without significant investment in digital infrastructure. Digital trade lowers one barrier to diversification while raising another. A country without reliable connectivity is now excluded from the cheapest available diversification path.
The macro backdrop: a weak year to be concentrated
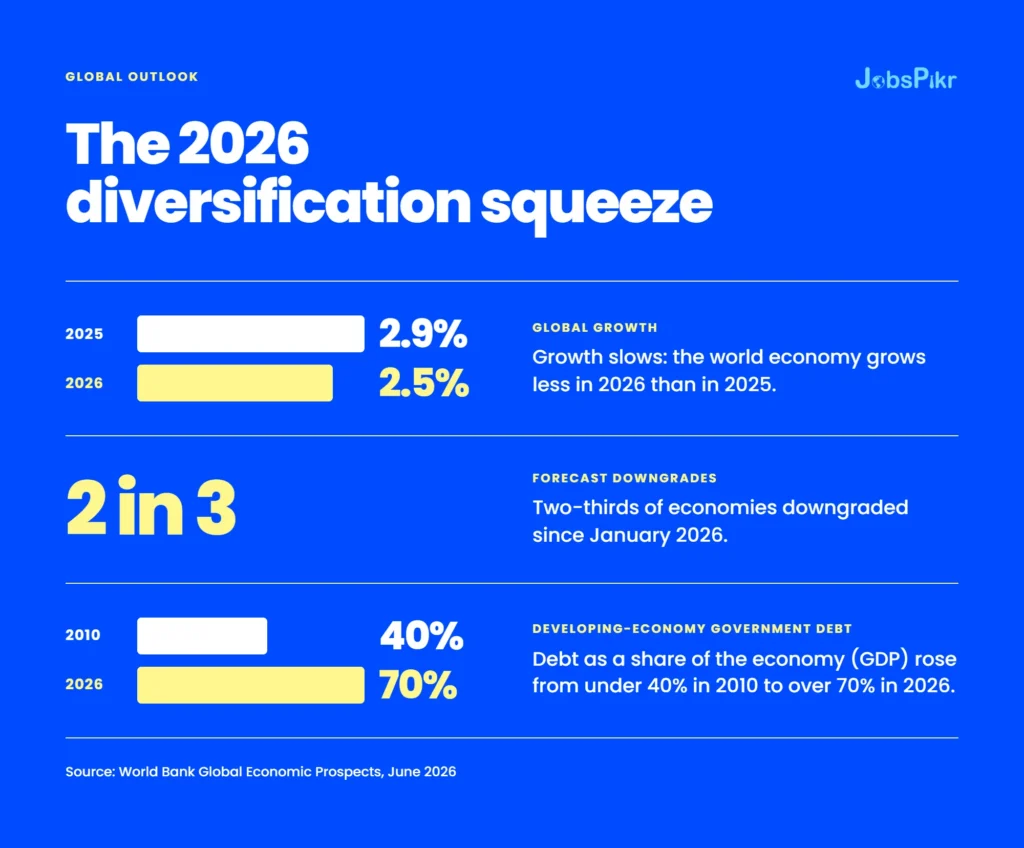
The World Bank’s June 2026 Global Economic Prospects forecast global growth slowing to 2.5 percent in 2026, down from 2.9 percent in 2025 and the weakest rate since the onset of the pandemic. Forecasts for two-thirds of economies were downgraded relative to January. Growth is expected to improve to 2.8 percent in 2027 while remaining 0.4 percentage points below the average of the 2010s.
The mechanism behind the downgrade is precisely the one diversification is meant to guard against. Conflict-driven energy price increases hit energy-importing economies hardest, with the effect concentrated among countries whose output and export base leave them little room to substitute. In a severe downside scenario involving more prolonged commodity disruption combined with financial stress, the same report put global growth as low as 1.3 percent. Separately, aggregate government debt across developing economies has climbed from under 40 percent of GDP in 2010 to over 70 percent, which narrows the fiscal room available to fund diversification at exactly the moment it is most needed.
The concentration paradox: the benchmark itself is narrowing
Here is the problem that almost no explainer of this topic addresses. If a relative diversity score measures distance from a benchmark economy, then the score moves when the benchmark moves. In 2026, the benchmark moved a great deal.
The United States sits at the top of the global diversification index and is simultaneously the reference economy for most regional relative indices. Its sector mix is concentrating.
| Signal | Figure | Period |
| Healthcare and social assistance share of new jobs | 123,000 of 130,000 total | January 2026 |
| Private payroll growth excluding healthcare | Roughly 35,000 per month | 2026 average |
| Healthcare share of total nonfarm employment | 13.2% rising to 15.0% | April 2016 to April 2026 |
| Healthcare share of all hires | Roughly 10% rising to 13% | Early 2016 to early 2026 |
| Industries growing more than 23,000 jobs | None outside food service and local government | Trailing twelve months |
| Industries contracting outright | Eleven | Trailing twelve months |
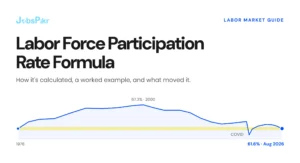
| Labour force participation rate | 61.6%, lowest outside the pandemic since 1976 | August 2026 |
Table 4. United States sector concentration signals, 2026. The reference economy for most relative diversity indices is itself becoming less diverse.
Remove healthcare and social assistance from the United States payroll figures and growth across the rest of the private sector averaged roughly 35,000 jobs per month through 2026. Remove healthcare, leisure and hospitality, and construction together and total payroll growth would have been negative across both 2024 and 2025.
What this does to a relative index score
Three regions could each post an improving relative diversity score in 2026 for three entirely different underlying reasons.
1. The region genuinely diversified. New sectors took root and employment spread out across them.
2. The region stood still while the benchmark concentrated. The gap closed from the other side, with no change in the region itself.
3. The region concentrated as well, only more slowly than the benchmark did.
Only the first is good news. A relative index score alone cannot distinguish between them. To tell which one you are looking at, you need the underlying sector shares, and you need them as a time series rather than a snapshot. This is the strongest practical argument for supplementing published annual indices with a current, internally maintained measure.

Climate exposure is now a diversification variable
Through most of the literature’s history, the case for economic diversity rested on market risk: commodity price swings, demand shocks, the collapse of a single dominant employer. The 2026 European summer added a second axis.
Europe’s heat summer, in GDP terms
An analysis of the 2026 European heat season estimated the total EU-wide GDP impact at around minus one percent, in the order of 180 billion euros. To put that in proportion, it is approximately the entire expected economic growth of the European Union for the year, and roughly one sixth of the size of the Dutch economy.
The damage is split unevenly, and the split is the interesting part.
| Country | Estimated GDP effect | Why |
| France | Growth reduced by 1.4 percentage points, potentially a contraction of about 0.6% | Large jump in hot days versus norm, moderate acclimatisation, below-average air conditioning penetration |
| Netherlands | About 0.8 percentage points of growth lost, leaving the economy roughly stagnant | Water stress driving transport and logistics disruption |
| Italy and Spain | High physical exposure, smaller marginal effect per hot day | Decades of acclimatisation reduce the incremental damage of each additional hot day |
| Poland | Least affected; still around 2.9% growth expected | Few excess hot days this year, combined with a high underlying growth forecast |
Table 5. Estimated national GDP effects of the 2026 European heat season. Exposure was determined by sector mix and adaptation, not by temperature alone.
Why sector mix determined the damage
The channels through which heat reached GDP were agriculture and food prices at roughly 0.15 percentage points, constrained energy generation at 0.12 to 0.15 points, and transport and logistics disruption at around 0.15 points. The largest channel by some distance was labour productivity.
That matters for diversification because labour productivity losses are not distributed evenly across sectors. Worker output falls measurably once temperatures pass a threshold somewhere around 25 to 30 degrees Celsius, and the effect concentrates in physically demanding, outdoor, or non-climate-controlled work. One cross-country estimate puts the macro-level loss at roughly three percent of output per hour worked for every degree above a 30-degree threshold, sustained over several days.
The four-factor vulnerability model
The vulnerability index used in that analysis is worth reproducing, because it is effectively a climate-adjusted diversification score and can be rebuilt for any region.
• The share of gross value added sitting in physically exposed sectors: construction, agriculture and industry.
• Average commute time, which determines exposure before the working day even begins.
• Air conditioning penetration, which is the cheapest and fastest partial adaptation.
• Historical acclimatisation, since the same absolute temperature carries a smaller marginal effect in an economy used to it.
A region whose economic activity is concentrated in construction and agriculture is not merely exposed to a construction downturn. It is exposed to a hot summer. Adaptation helps but only partially: one modelled European estimate suggests it could cut labour productivity losses by around forty percent without eliminating them. Sector diversification is the more durable hedge, because it changes the denominator rather than the damage rate.

Economic diversification as climate adaptation
The policy world reached this conclusion before the economics commentary did. Economic diversification has been a formal workstream under the UNFCCC’s Nairobi Work Programme, where the objective is to help countries exchange experience on measures, methodologies and tools that increase economic resilience, and to understand how diversification can be integrated into sustainable development planning.
The framing there treats diversification as a dual-purpose instrument. It supports growth, and it reduces dependence on products, markets and jobs that are physically vulnerable to a changing climate. For a region running a diversification programme in 2026, that suggests a practical screening question that would not have appeared on the list a decade ago: of the sectors we are trying to grow into, how many are physically exposed to heat, drought or flooding, and does the new mix actually reduce our aggregate exposure or simply relabel it?
Why economic diversity affects hiring, wages and workforce planning
Regional analysis has consistently found that among metropolitan areas above 500,000 population, the more economically diverse group averages roughly a percentage point lower unemployment than the less diverse group, with the gap widening during downturns. In the most diverse large metros, the five largest industries account for around seventeen percent of employment. In the least diverse, that figure is closer to twenty-six percent.
Wage competition
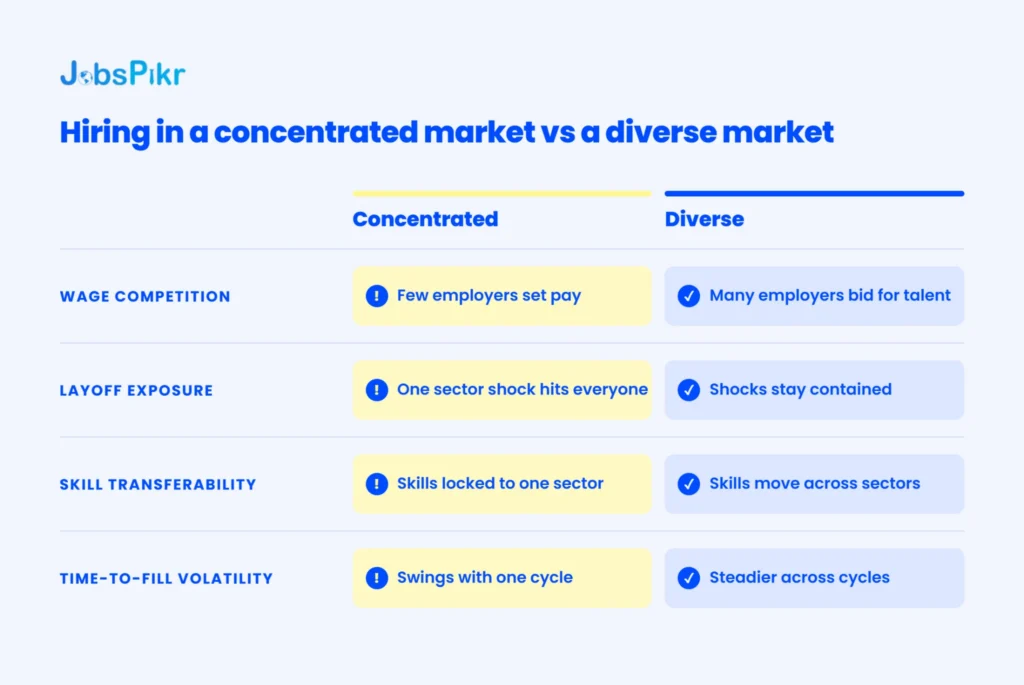
In a concentrated market, you compete for the same candidate pool as every other employer in the dominant sector. Salary bands compress upward quickly, and the compression accelerates whenever that sector has a strong quarter. Your compensation benchmark is effectively set by a single industry’s cycle, which you do not control.
Layoff exposure
A single-sector downturn either floods a local market with candidates you cannot absorb or drains it entirely, with no offsetting demand elsewhere to smooth the swing. Concentrated markets are more volatile in both directions, which makes headcount planning harder even when the average is fine.
Skill transferability
A diverse economy produces candidates whose skills move between industries. That widens the viable funnel for the same role. A supply chain analyst from a logistics firm is a credible hire for a hospital system in a diverse metro and a much harder sell in a metro where those two sectors barely coexist. Transferability is the quiet mechanism behind the unemployment gap, and it is invisible in a sector-share table.
How to measure economic diversity in your own market
Published indices are annual and lag the market by a year or more. Job postings are current, which makes them useful as a leading indicator between releases. The method below produces a posting-based concentration score that reads in the same direction as HHI.
A five-step method
4. Pull every active posting for your target region over a rolling 90-day window, tagged by NAICS or an equivalent industry classification. Ninety days smooths seasonal noise without blurring a genuine trend.
5. Calculate posting share by industry, then square each share and sum them. That is your posting-based HHI.
6. Run the same calculation on national postings for the identical window, and express your region as a ratio of the national figure. This gives you a relative reading built on hiring demand rather than on headcount.
7. Track the trend quarterly. Direction matters more than level. A rising ratio means your market is narrowing relative to the benchmark.
8. Repeat the calculation segmented by skill family rather than industry. A region can look diverse by NAICS while every posting demands the same five skills. Skill concentration is the failure mode that industry classification misses entirely.
What to instrument
| Data input | Why it is needed | Cadence |
| Active postings by industry code | The core numerator for the concentration calculation | Daily collection, 90-day rolling window |
| Postings by skill family | Catches concentration that industry codes hide | Monthly |
| National postings baseline | Converts an absolute score into a relative one | Matched to the regional window |
| Employer concentration within sector | Distinguishes a broad sector from one large employer | Quarterly |
| Published index release | Annual validation against an external benchmark | Annual |
| Physically exposed sector share | Climate exposure overlay on the diversification score | Annual |
Table 6. Minimum data inputs for maintaining a current economic diversity measure, mapped to collection cadence.
A decision matrix for the result
| Reading versus benchmark | Interpretation | Recommended action |
| Well below, stable | Genuinely diverse and resilient | Standard sourcing budget; safe candidate for a hub |
| Well below, rising | Diversifying away, early stage | Re-check quarterly; identify which sector is gaining share |
| Above benchmark, stable | Concentrated but predictable | Budget a wage premium for roles in the dominant sector |
| Above benchmark, rising | Concentrating quickly | Treat as single-sector risk; plan a second market |
| Below by NAICS, above by skill | Hidden skill concentration | Widen sourcing radius; expect long time-to-fill on the contested skill |
Table 7. What to do with each reading. The rising cases matter more than the level, because they are the ones an annual index will report a year late.

Frequently asked questions
What is economic diversity?
Economic diversity is the spread of an economy’s employment and output across multiple industries rather than concentration in a few. It is normally measured by comparing a region’s industry mix against a benchmark economy, or by computing a concentration statistic such as the Herfindahl-Hirschman Index across sector shares.
What is the difference between economic diversity and economic diversification?
Economic diversity is the current state of the sector mix. Economic diversification is the deliberate process of broadening it. One is a measurement taken at a point in time; the other is a strategy pursued over years or decades.
What does a diverse economy mean?
A diverse economy is one where no single industry dominates employment or output, so that a downturn in any one sector does not take the whole economy with it. The practical test is whether displaced workers have somewhere else to go without relocating.
Is a higher economic diversity index score better?
It depends entirely on the index. On relative diversity indices, the benchmark economy is assigned zero, and higher scores mean less diverse. On a Shannon-Weaver entropy index, higher means more diverse. On the Herfindahl-Hirschman Index, higher means more concentrated. Always confirm the direction before comparing figures from different sources.
Which countries are the most economically diversified in 2026?
The Global Economic Diversification Index 2026 places the United States, China, and Germany in the top three positions. Among commodity-dependent economies, Mexico and Malaysia lead, while Saudi Arabia, the United Arab Emirates and Qatar have shown the most significant progress since 2000.
What is economic inclusion, and is it the same thing?
No. Economic inclusion covers access to financial services, employment, and economic opportunity across population groups. It measures who participates in an economy rather than which industries compose it. The two are frequently conflated in search results and answer boxes.
How does climate change affect economic diversity?
In two ways. Physically, economies concentrated in exposed sectors such as construction, agriculture and outdoor industry lose more output to extreme heat, drought and flooding. Strategically, international climate policy now treats diversification as an adaptation measure, because moving away from climate-vulnerable products, markets and jobs reduces both emissions exposure and economic risk at the same time.
How do I know if a city has enough job diversity to relocate without an offer?
Count the distinct industries actively posting for your role in that market over the last ninety days, not the total number of openings. Three hundred postings from a single employer is concentration risk wearing the costume of a strong market. Sixty postings spread across eight industries is a genuine market with fallback options.