- Inflation Under Trump: Getting Grounded with Price Movements
- The Policy Shifts Under the Trump Administration
- Tracking Prices: The Inflation Story (Pre-Pandemic)
- Trump vs Biden Inflation: A Flawed Comparison
- The Enduring Lessons for Workers and Businesses
- The Bottom Line Reality
- Frequently Asked Questions
When we examine the Trump presidency’s economic record, one question keeps resurfacing: how did inflation under Trump actually interact with those headline-grabbing job numbers and workers’ paychecks? Did moderate price increases secretly fuel employment growth? Or did they quietly undermine wage gains despite record-low unemployment?
Inflation Under Trump: Getting Grounded with Price Movements
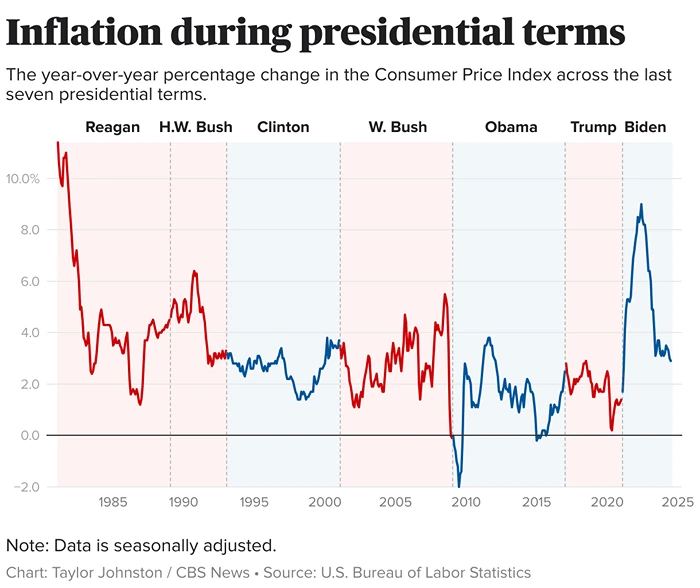
Image Source: CBS News
Before dissecting 2017-2019, let’s ditch textbook simplicity. Inflation – that slow burn where your grocery bill creeps up year after year – is typically measured by the Consumer Price Index. The CPI tracks what urban households actually buy: bread, rent, hospital visits, and gasoline. The inflation formula itself is straightforward arithmetic: [(Current Price – Base Price) / Base Price] x 100. But its effects? Far messier.
Economists have long wrestled with the Phillips Curve idea – that ultra-low joblessness might push prices upward. The theory goes like this: when employers scramble for scarce workers, they offer higher pay. Those labor costs often get passed to consumers. Meanwhile, employed folks spend freely, furthering heating demand. Conversely, high unemployment usually cools this engine.
But real economies laugh at tidy models. Global oil shocks matter. Supply chain kinks matter. A trade war? That matters hugely. And worker bargaining power? Absolutely critical.
The Policy Shifts Under the Trump Administration
The Trump administration bet heavily on these three levers –
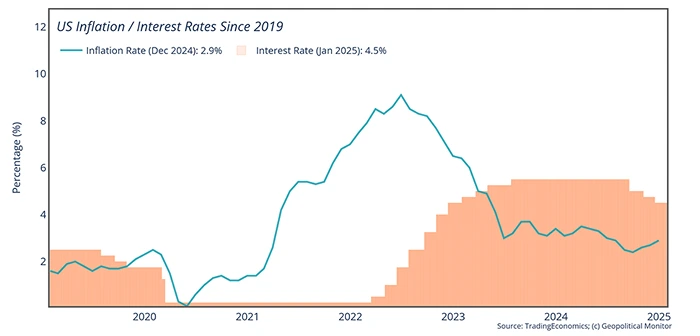
Image Source: Geopolitical Monitor
The 2017 Tax Cuts (TCJA): This slashed corporate rates from 35% to 21% and trimmed personal taxes for many. The pitch was simple: spur business investment and consumer spending. Critics warned it might overheat things.
Tariffs – Especially on China: This became Trump’s economic signature. Heavy duties hit Chinese goods and global steel/aluminum. The Trump tariffs aimed to shield U.S. factories and revive manufacturing jobs. Reality proved less straightforward – these taxes directly raised costs for importers and consumers. My review of Federal Reserve Bank of New York studies suggests they added 0.2-0.4 points to inflation before supply chains fully convulsed.
Rolling Back Regulations: Aggressive cuts hit environmental, financial, and energy rules. The theory? Freeing businesses from “red tape” lowers costs and sparks hiring. Measuring this impact is notoriously fuzzy.
Let’s look at how things felt in real homes
Statistics tell one story. Paycheck stubs and grocery receipts tell another story. To understand the true impact of inflation under Trump on workers, we need to step away from national averages and into actual households. The data shows modest real wage growth overall. But averages are statistical illusions – they smooth over jagged realities.

Image Source: BBC
Consider these contrasting scenarios unfolding simultaneously in 2018 (when inflation hit 2.4%):
1. The Registered Nurse in Cleveland:
- Received a 4% raise after her hospital’s strong year.
- Faced the year’s 2.4% inflation, meaning prices rose across the board.
- Her Reality: After weathering price hikes at the gas pump and supermarket, she still had a little extra breathing room each month. Maybe she paid down a credit card or saved for a used car. Her nominal raise meaningfully outpaced the inflation rate, translating into tangible, if modest, gains. This felt like progress.
2. The Retail Associate in Phoenix:
- Got a standard 2.1% annual raise – common in big-box retail.
- Also faced the same 2.4% inflation.
- Her Reality: Her slightly bigger paycheck vanished entirely at the register. The extra $30 per week was swallowed by higher costs for basics: milk, eggs, car insurance, and utilities. Her purchasing power was stagnant. She worked the same hours just to stay even. “Getting ahead” felt impossible.
3. The Young Software Developer in Austin:
- Landed a competitive 3.5% raise in a hot tech market.
- Confronted Austin’s exploding rents, which surged 5.8% that year alone (Zillow Observed Rent Index).
- His Reality: Despite a seemingly decent raise, his biggest expense – housing – leapt far faster. That 3.5% raise couldn’t cover the extra $150/month on his lease renewal. He dipped into savings or cut discretionary spending (dinners out, hobbies). His nominal gain was erased by a single essential cost. He didn’t feel richer, even with a good job.
The Hidden Culprit: When Essentials Outpace the CPI
The official inflation formula (CPI) blends everything – from televisions to tomatoes. But human lives aren’t averages. During the Trump years, critical expenses consistently ran hotter than the headline number:
- Healthcare Costs: Rose +4.2% annually on average, 2017-2019 (BLS CPI Medical Care Index) – nearly double the overall CPI at times. Prescriptions and copays go deeper.
- Childcare & Education: Prices climbed relentlessly, squeezing young families regardless of wage gains.
- Rent: Nationally, rent inflation averaged +3.6% 2017-2019 (BLS) – significantly outpacing overall CPI (+2.1% avg). In hot markets (Austin, Nashville, Phoenix), 5-8% annual rent hikes were common.
Why Two Workers with “Good” Jobs Felt Worlds Apart:
- The Homeowner vs. The Renter:
- A mid-career factory worker owning a home with a fixed mortgage might see a 3% raise easily outpace 2.4% inflation. Their biggest expense (housing) was locked in.
- A younger worker renting an apartment saw their largest bill jump 5-6%, instantly consuming their entire raise (or more). Geographic luck and life stage became huge determinants of financial well-being.
- Health Status Matters:
- A single, healthy worker with employer-subsidized insurance might barely notice healthcare inflation.
- A family managing chronic conditions or facing high-deductible plans felt every percentage point increase in premiums, deductibles, and drug costs, directly cutting into disposable income from raises.
The Crucial Takeaway: Averages Mask Reality
Moderate inflation under Trump, as a single number, didn’t universally crush wage gains. For some, like the Cleveland nurse, nominal raises provided real relief. But for millions like the Phoenix retail worker or the Austin renter, even keeping pace on paper felt like running in place. When essential costs – the ones you can’t avoid – surge faster than your paycheck and faster than the official inflation rate, progress evaporates.
This divergence explains why economic confidence surveys often showed a disconnect from strong macro numbers: lived experience varied wildly based on location, industry, housing status, and health costs. The “average” masked deep fractures in how inflation under Trump actually landed in American wallets.
Tracking Prices: The Inflation Story (Pre-Pandemic)
Contrary to doomsayers, broad inflation under Trump stayed remarkably contained until COVID:
- 2017: CPI averaged 2.1% – kissing the Fed’s target.
- 2018: Jumped to 2.4% – driven partly by oil spikes and early tariff effects washing through.
- 2019: Eased back to 1.8% – almost puzzlingly calm.
- Early 2020: Hovered near 2.3% (BLS monthly CPI summaries).
While generally stable, the Trump tariffs did cause visible price jumps. Washing machines surged nearly 20% after duties hit (Harvard study). Steel users faced cost hikes. This wasn’t an economy-wide wildfire, but targeted burns affecting specific supply chains and consumers. The overall inflation rate impact was measurable but modest pre-2020, perhaps 0.3 points according to Peterson Institute analyses.
Examining Purchasing Power: Did People Actually Gain?
Let’s break down the way the market changed in the past few years –
- Wages climbed around 3.5% per year
- Inflation ran about 2%
- Real wage gain looks like 1.5%—not life-changing, but a gain
But if major regular bills rose faster, that gain could feel like zero or a loss. This shows the importance of looking past simple averages and understanding the cost-of-living landscape people actually face.
Tariffs did more than add cents here and there:
- Industries using a lot of steel or metal paid more—cars, appliances, even skyscrapers
- Some companies ate the cost to stay competitive, squeezing profit margins
- Consumers felt it in slightly higher prices, but it wasn’t a crisis
So, trump tariffs were noticeable for some, but not broad enough to distort everything else. Here’s a simplified look at inflation year by year:
- 2017: ~2.1%
- 2018: ~2.5%
- 2019: ~1.8%
- 2020: ~1.2%
- 2021: ~7.0%
- 2022: ~9.0%
This snapshot highlights how dramatically inflation changed post-2020—and how different that world is from inflation under Trump.
Trump vs Biden Inflation: A Flawed Comparison
Search trends love inflation under Trump vs Biden, but context is everything:
Trump (2017-19): Operated in relative global stability with spare capacity.
Biden (2021+): Inherited a scrambled supply chain, war-driven commodity spikes (Ukraine), and pent-up demand, creating perfect conditions for the 2022 inflation spike. Fed rate hikes followed aggressively.
Wage Differences: Under Biden, nominal wage growth ran hotter (5-6% peak), but was devoured by 9% inflation initially. Only recently did real wages turn positive as inflation cooled. Trump’s tighter pre-pandemic labor market produced milder nominal gains but less inflationary loss.
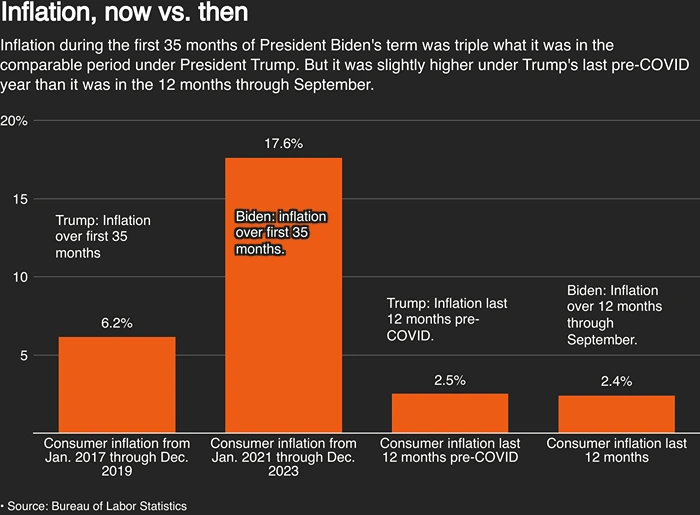
Image Source: Reuters
The Enduring Lessons for Workers and Businesses
Why does this history matter now?
- Look Past the Unemployment Rate: Record lows don’t guarantee strong real wage growth. Dig into sector-specific BLS job market reports and CPI breakdowns.
- Inflation is a Silent Tax: Even “moderate” 2-3% inflation steadily erodes purchasing power if wages don’t outpace it significantly. This dynamic hurt workers more than job scarcity did pre-2020.
- Tariffs Have Concrete Costs: Protectionism raises consumer prices – a direct hit to real wages. Job benefits are localized and uncertain.
- Worker Power Matters: Without strong bargaining leverage (unions, scarce skills), even tight labor markets struggle to deliver robust real gains against inflation.
The Bottom Line Reality
Inflation under Trump remained generally subdued before the pandemic, coexisting with impressive job creation. Nominal wages grew respectably. But the crucial metric – real wage growth – revealed stagnation for many working Americans. Gains were eroded by persistent inflation (amplified in sectors hit by tariffs), globalization’s wage ceiling, and weakened worker bargaining power.
This era demonstrated that low unemployment alone can’t overcome structural forces suppressing purchasing power. True US labor market health requires not just jobs, but jobs paying wages that consistently outpace the cost of living – a challenge still unmet.
Frequently Asked Questions
When was inflation highest in U.S. history?
The highest inflation in U.S. history occurred during the early 1980s, with the peak rate reaching around 14.8% in March 1980. This period of soaring inflation was driven by a mix of factors, including oil price shocks, loose monetary policy in the 1970s, and wage-price spirals. The Federal Reserve, under Chairman Paul Volcker, eventually brought inflation under control by raising interest rates aggressively, which also led to a brief but sharp recession.
What was the inflation rate in 2016?
In 2016, the U.S. inflation rate was relatively low and stable. The Consumer Price Index (CPI) rose by about 1.3% for the year. This was part of a long stretch of low inflation following the 2008 financial crisis, during which the Federal Reserve kept interest rates low to stimulate spending and investment.
Is U.S. inflation declining?
As of mid-2025, U.S. inflation has been declining from its post-pandemic highs. After peaking in 2022 at over 9%, inflation has gradually eased due to higher interest rates, supply chain stabilization, and slower consumer demand. The Federal Reserve’s policy of raising interest rates helped reduce price growth, though it also cooled certain areas of the economy like housing and lending.
Current inflation rates are trending closer to the Fed’s 2% target, but some categories—like food, energy, and housing—may still experience persistent price pressures depending on market conditions.