- **TL;DR**
- The problem with traditional employee count sources
- Step-by-step estimation process
- Ready to put job-posting math to work?
- Common pitfalls and how to avoid them
- The calculation in practice: complete example
- A Smarter Way to Estimate the Number of Employees
- Ready to put job-posting math to work?
- FAQs
**TL;DR**
- Estimate a company’s employee count by converting clean, deduplicated job-posting totals into headcount using industry vacancy rates and time-to-fill, giving a current, defensible figure when LinkedIn and 10-K disagree.
- Apply the vacancy-rate formula to deduplicated open roles so JOLTS-backed vacancy rate benchmarks turn your job-posting counts into a math-based employment estimate.
- Deduplicate aggressively—use job IDs, description hashes and location filters—because raw job-posting feeds often contain 30–45% duplicates that would otherwise inflate your employee-count signal.
- Use Little’s Law with realistic time-to-fill assumptions (longer for senior roles) to convert open job-posting volume into hires per month and expose the true hiring velocity.
- Translate median tenure into expected separations and treat postings as backfills vs. growth; varying backfill percentages produces conservative, moderate, and aggressive headcount scenarios.
- Validate job-posting–derived estimates against revenue-per-employee bands and office square footage; if your employee-count falls outside those norms, revisit vacancy rates, deduplication, or role mix.
- Build a repeatable spreadsheet capturing raw postings, deduplication factor, industry vacancy rate, time-to-fill and tenure so you produce defensible employee-count ranges instead of false precision.
LinkedIn says your competitor has 5,000 employees. Their website claims 3,200. The last 10-K filing shows 4,100. Which number do you trust?
LinkedIn’s employee totals rely on members updating their own profiles. In practice, only 10–20% mirror current employment. Departed staff leave stale listings, contractors are included, and subsidiary structures fragment counts and inflate the headline number. This guide teaches a repeatable way to turn job-posting data into reliable headcount estimates using vacancy rates, time-to-fill, and sector benchmarks. Expect clear formulas, a step-by-step model, and fresh inputs to triangulate when official sources conflict.
The problem with traditional employee count sources
LinkedIn’s accuracy challenges
LinkedIn explicitly warns users that computed employee counts can differ from reality. The platform depends entirely on members updating their own profiles.
Common scenarios that break LinkedIn accuracy:
- Companies with 30 actual employees showing 350 on LinkedIn
- One-person firms displaying 1,500+ “employees” due to profile misattribution
- Stealth subsidiaries and DBAs creating fragmented counts
- Former employees lingering in counts months after departure
SEC filing limitations
10-K employee disclosures provide official numbers, but they’re snapshots—usually annual, often stale by mid-year. After mergers or restructuring, these numbers become even less reliable.
Point-in-time reporting means you’re always looking backward, not at current reality.
The contractor blind spot
Neither LinkedIn nor most official filings clearly distinguishes between full-time employees, contractors, consultants, and third-party workers. For companies heavily dependent on the contingent workforce, this creates massive distortions.
The vacancy rate method: your mathematical foundation
Instead of guessing, use the relationship between open roles and total employment. This method leverages the Job Openings and Labor Turnover Survey (JOLTS) methodology used by the Bureau of Labor Statistics.
Core formula
The vacancy rate equation: v = V ÷ (E + V)
Where:
- v = vacancy rate (from industry benchmarks)
- V = number of open positions (from job postings)
- E = total employment (what we’re solving for)
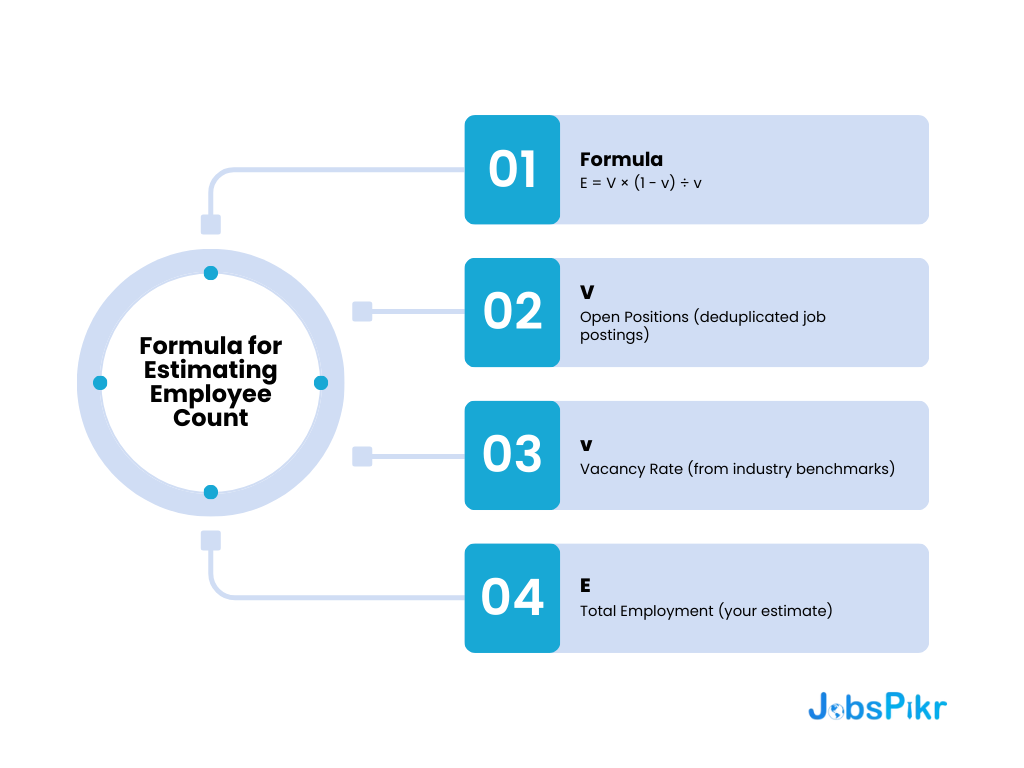
Rearranged to solve for employment: E = V × (1 – v) ÷ v
Industry vacancy rates (July 2025)
In July 2025, the overall job-openings rate is 4.3%, and rates differ widely by sector:
| Industry | Vacancy Rate | What this means |
| Information | 6.4% | Higher demand, tech hiring remains active |
| Professional & Business Services | 5.5% | Strong demand for specialized skills |
| Leisure & Hospitality | 5.5% | Ongoing staffing challenges |
| Health Care & Social Assistance | 5.1% | Persistent healthcare worker shortage |
| Financial Activities | 4.3% | Moderate hiring pace |
| Construction | 3.5% | Steady but controlled growth |
| Manufacturing | 3.3% | Lower turnover, stable workforce |
| Retail Trade | 3.2% | Seasonal variations apply |
Quick example
A software firm shows 120 deduplicated openings. With the Information sector vacancy of 6.4%:
E = 120 × (1 − 0.064) ÷ 0.064 → E = 120 × 0.936 ÷ 0.064 → E ≈ 1,755 employees.
Step-by-step estimation process
Step 1: Collect and clean job postings
Pull raw postings from the careers site, major boards, and aggregators.
Critical: Deduplicate aggressively. The same role often appears:
- Across multiple job boards
- In different locations for remote positions
- With slight title variations
- As “evergreen” postings refreshed monthly
Without deduplication, you might count the same “Senior Software Engineer” role five times.
Step 2: Apply the vacancy rate formula
Select the appropriate industry rate from JOLTS data. If the company spans multiple industries, weight your calculation accordingly.
For a fintech company (50% tech, 50% finance):
- Use 6.4% for tech positions
- Use 4.3% for finance positions
- Calculate weighted average or separate estimates
Step 3: Factor in time-to-fill dynamics
Little’s Law connects inventory (open roles) with throughput (hires) and cycle time:
Open Roles = Hires per Month × Time-to-Fill (months)
Current benchmarks:
- Average time-to-fill: 42–54 days across sectors
- Senior engineering: 62+ days
- Entry-level positions: 25-30 days
This helps you estimate monthly hiring velocity: Hires per Month = Open Roles ÷ Time-to-Fill
Step 4: Account for separations and backfills
Treat postings as both growth and replacement.
Median tenure fell to 3.9 years in January 2024—the lowest since 2002—signaling elevated turnover across sectors.
Industry-specific tenure patterns (January 2024):
| Industry | Median Tenure | Implied Annual Turnover |
| Mining, Oil & Gas | 5.7 years | ~17.5% |
| Manufacturing | 4.9 years | ~20.4% |
| Financial Activities | 4.7 years | ~21.3% |
| Professional Services | 3.7 years | ~27.0% |
| Health Care | 3.5 years | ~28.6% |
| Retail Trade | 2.9 years | ~34.5% |
| Leisure & Hospitality | 2.1 years | ~47.6% |
Step 5: Build your estimate range
Create three scenarios:
Conservative estimate: Assume 70% of postings are backfills
- Apply higher separation rates
- Use longer time-to-fill
- Round down final numbers
Moderate estimate: Assume 50% backfills, 50% growth
- Use industry-average metrics
- Apply standard vacancy rates
Aggressive estimate: Assume 30% backfills, 70% growth
- Shorter time-to-fill
- Factor in seasonal hiring surges
- Consider expansion announcements
Ready to put job-posting math to work?
Schedule a quick demo to get hands-on with Jobspikr’s standardized job data to power your headcount estimates and competitive analysis.
Common pitfalls and how to avoid them
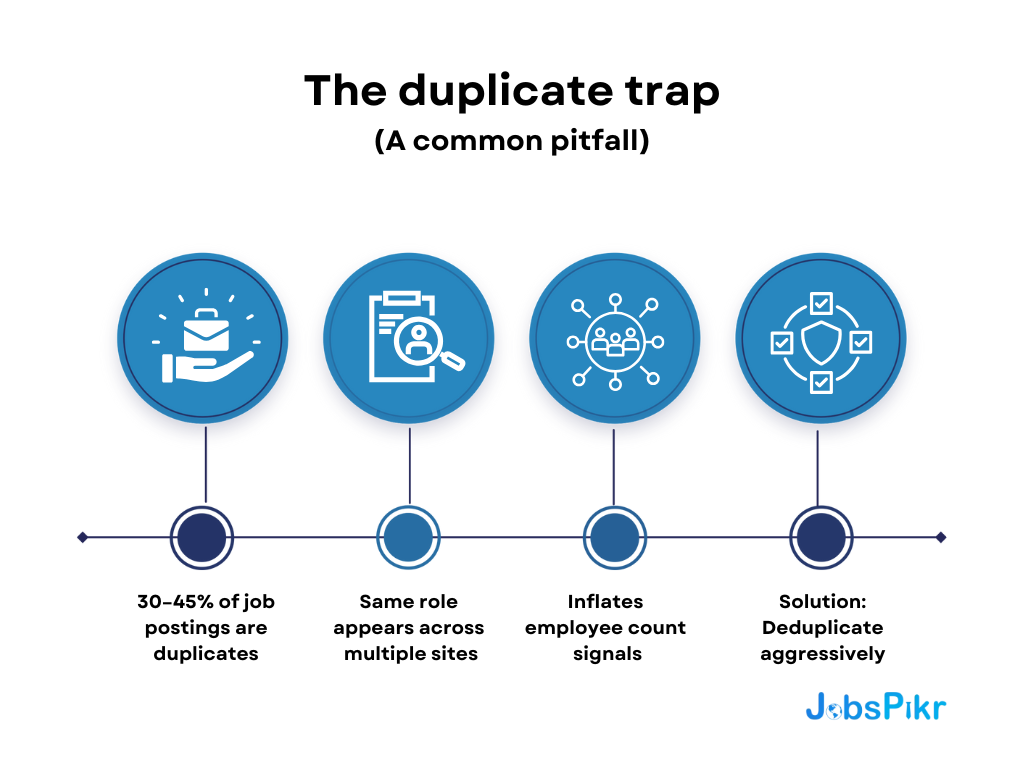
Research shows job posting datasets can contain 30-45% duplicates without proper filtering. A single “Customer Success Manager” role might appear:
- On the company site
- LinkedIn Jobs
- Indeed (with auto-refresh)
- Glassdoor
- Industry-specific boards
- Regional job sites
Solution: Use posting IDs when available. Compare job descriptions with semantic matching. When in doubt, undercount rather than overcount.
Evergreen posting inflation
Companies keep “always hiring” posts for high-turnover roles. One “Sales Development Representative” posting might represent a pipeline, not a single position.
Look for:
- Generic location tags (“Multiple Locations”)
- Broad experience ranges (“0-10 years”)
- Missing specific team or manager information
Adjust these down by 50-75% in your count.
The subsidiary shuffle
Large companies post jobs under different entities:
- Parent company brand
- Regional subsidiaries
- Recent acquisitions
- Different business units
Map all related entities before collecting postings. Check SEC filings for subsidiary lists.
Geographic distribution errors
Remote-first firms often list one role under “New York,” “San Francisco,” and “Remote USA.” Count it once, not three.
Filter on unique job IDs or description hashes, not titles.
Industry-specific adjustments
Technology companies
Tech teams keep larger posting pipelines relative to realized hires.
Adjustments:
- Increase time-to-fill to 60+ days for senior engineering
- Account for 20-30% offer decline rates
- Factor in hiring freezes that leave postings active
Retail and hospitality
High turnover means more postings are backfills.
Adjustments:
- Assume 60–80% of postings are backfills
- Apply seasonal factors (Q4 holiday cycles)
- Account for part-time versus full-time mix
Healthcare organizations
Specialized roles take longer to fill and show lower offer-decline rates.
Adjustments:
- 70+ day time-to-fill for clinical specialists
- Regulatory requirements affecting start dates
- Contract vs. permanent staff ratios
Manufacturing
Lower posting-to-hire ratios but longer employee tenure.
Adjustments:
- Batch hiring for new shifts or facilities
- Apprenticeship programs (long fill times)
- Union hiring processes
Validation techniques
Cross-check with financials
Revenue per employee by industry:
- Software: $200,000–$500,000
- Manufacturing: $150,000–$300,000
- Retail: $50,000–$150,000
- Professional services: $100,000–$250,000
If your result lands outside these bands, reexamine the inputs.
Check against office footprint
Typical allocation: 150–250 square feet per employee.
A 100,000-square-foot lease implies roughly 400–650 people, not 2,000.
Monitor posting velocity changes
Track monthly counts. Sharp spikes can signal:
- Expansion or a new product launch
- Seasonal campaigns
- Large-scale replacement after layoffs
A steady climb points to organic growth.
Compare against peers
Companies in the same sector and region tend to show similar employee-to-revenue ratios. If peers average 5 employees per $1M and your model yields 15, revisit the calculations.
Labor market context
In July 2025, JOLTS reported 7.2 million openings nationwide, continuing a gradual cooldown from pandemic highs.
Key trends affecting your estimates:
- Job openings fell to their lowest level in ten months
- Hiring remains flat across most sectors
- Time-to-fill increasing as companies become more selective
- Geographic variations intensifying (some regions much tighter than others)
Expect longer-lived postings. Increase time-to-fill assumptions by 10–15% versus historical norms.
Building your estimation template
Create a spreadsheet with these inputs:
Data collection
- Raw posting count
- Deduplication factor (typically 0.6-0.7)
- Clean posting count
- Industry classification
Industry benchmarks
- Vacancy rate (from JOLTS)
- Median tenure
- Time-to-fill
- Typical offer acceptance rate
Calculations
- Base employment (vacancy formula)
- Monthly hire rate (Little’s Law)
- Monthly separation rate
- Net change estimate
Outputs
- Conservative estimate (high backfill)
- Moderate estimate (balanced)
- Aggressive estimate (growth mode)
- Revenue per employee check
- Office space check
Special cases and exceptions
Pre-IPO companies
Often show inflated posting counts as they build infrastructure for public company requirements. Reduce posting count by 20-30% to account for “building ahead” behavior.
Post-merger integration
Expect 6-12 months of posting chaos:
- Duplicate functions across entities
- Frozen requisitions appearing active
- Reposted roles after reorganization
Best approach: wait for integration completion or use pre-merger baselines.
Seasonal businesses
Apply monthly adjustment factors:
- Retail: 1.5-2x multiplier for Q4
- Tax services: 2-3x for Q1
- Tourism: varies by geography
Startups
High posting-to-employee ratios due to:
- Optimistic growth planning
- Limited recruiting resources
- Competitive posting strategy
Assume only 40-60% of postings represent immediate hires.
The calculation in practice: complete example
Let’s estimate headcount for a B2B software company:
Data gathered
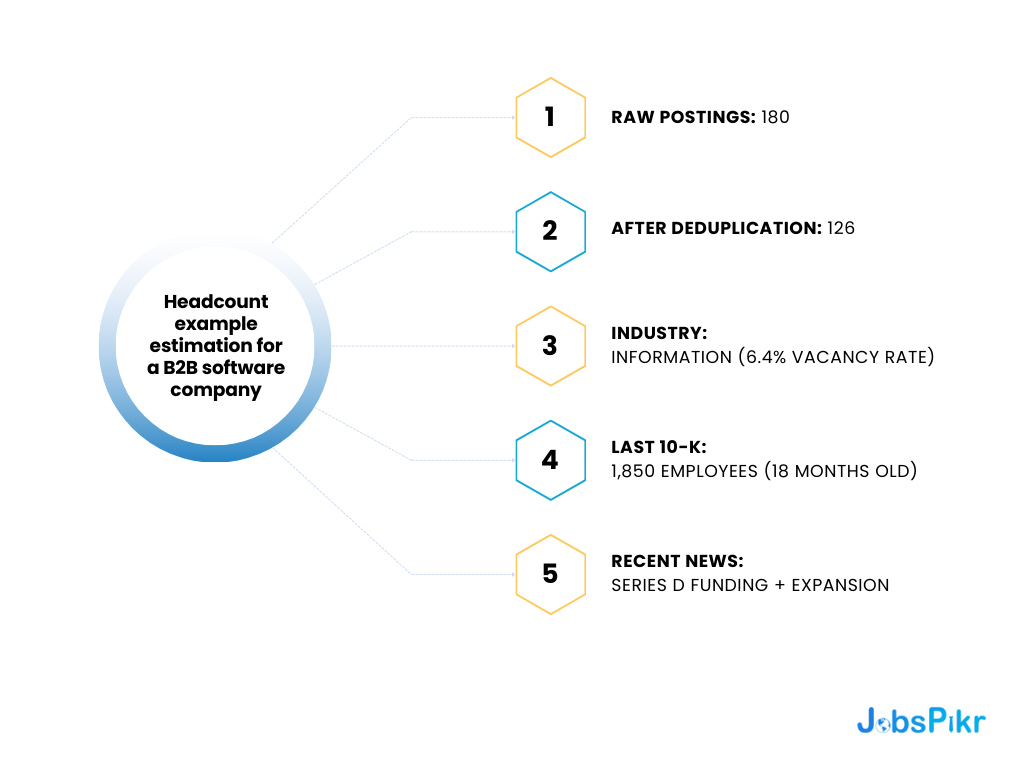
- 180 job postings (raw)
- After deduplication: 126 postings
- Industry: Information (6.4% vacancy rate)
- Last 10-K: 1,850 employees (18 months old)
- Recent news: Series D funding, expansion announcement
Calculation process
Base estimate: E = 126 × (1 – 0.064) ÷ 0.064 E = 126 × 14.625 E = 1,843 employees
Hiring flow analysis:
- Time-to-fill (tech): 55 days = 1.83 months
- Monthly hires: 126 ÷ 1.83 = 69 hires/month
Separation estimate:
- Tech industry tenure: 4.2 years
- Monthly separations: 1,843 ÷ 50.4 = 37 employees/month
Net growth: 69 hires – 37 separations = 32 employees/month
Projection from last known count: 1,850 + (18 months × 32) = 2,426 employees
Final estimate range:
- Conservative: 2,100-2,200
- Moderate: 2,300-2,400
- Aggressive: 2,500-2,600
Validation:
- Previous revenue: $400M
- Revenue per employee at 2,350: $170,000
- Industry benchmark: $150,000-$350,000 ✓
The moderate estimate of 2,300-2,400 aligns with funding announcement and falls within industry benchmarks.
A Smarter Way to Estimate the Number of Employees
Estimating employee count doesn’t require insider information or expensive data services. You need:
- Clean job posting data (deduplicated, categorized)
- Current industry vacancy rates (4.3% overall, varies by sector)
- Time-to-fill benchmarks (42-60+ days)
- Separation rates based on tenure data
The formula is straightforward: E = V × (1 – v) ÷ v
But the real value comes from understanding what drives the numbers. High vacancy rates signal growth or turnover. Long time-to-fill indicates competitive hiring or specialized roles. Short tenure means constant backfilling.
Begin with the base calculation, then layer company-specific context: funding, seasonality, industry dynamics, and geography. Aim for a defensible range, not a false precision. A grounded 2,000–2,400 estimate beats an exact-looking 2,237 with weak support.
The framework scales from startups to global enterprises and flexes with market shifts. Most importantly, it delivers a repeatable method when LinkedIn counts and stale filings conflict. So, your next competitive analysis doesn’t have to start with “approximately” or “estimated.” It can start with math.
Ready to put job-posting math to work?
Schedule a quick demo to get hands-on with Jobspikr’s standardized job data to power your headcount estimates and competitive analysis.
FAQs
1. How to find the number of employees of a company?
Check the company’s latest 10-K filing (for public companies) in the business section. For private companies, look at LinkedIn company pages, though these rely on self-reported data and can be off by 20-80%. A more reliable method: count their deduplicated job postings and apply the vacancy rate formula (E = V × (1-v) ÷ v) using industry benchmarks. This gives you a data-driven estimate based on actual hiring activity.
2. How to calculate employee count?
Use the vacancy rate method: Take the number of open positions (V), find your industry’s vacancy rate (v) from JOLTS data, then calculate E = V × (1-v) ÷ v.
Example: A tech company with 50 open roles and 6.4% industry vacancy rate has approximately 50 × 0.936 ÷ 0.064 = 731 employees. Adjust for duplicates in job postings and factor in turnover rates for better accuracy.
3. How to estimate headcount?
Start with three data points: current job postings (deduplicated), industry vacancy rate (from JOLTS), and median tenure for the industry. Apply the vacancy formula for a base estimate. Then factor in monthly separations using tenure data, estimate hiring velocity with time-to-fill metrics, and create low/medium/high scenarios based on what percentage of postings are backfills versus growth positions. Validate against revenue per employee benchmarks.
4. How to calculate the headcount formula?
The core headcount formula from vacancy data is: Headcount = Open Positions × (1 – Vacancy Rate) ÷ Vacancy Rate
Or in Excel: =V*(1-v)/v where V is open positions and v is the decimal vacancy rate.
For dynamic estimates, add Little’s Law: Monthly Hires = Open Positions ÷ Time-to-Fill (in months). Subtract monthly separations (Headcount ÷ Average Tenure in months) to get net growth.
5. How to judge company size?
Multiple quick checks work together: Employee count (from filings or estimates), annual revenue, office square footage (150-250 sq ft per employee is standard), and industry comparisons.
Size categories typically break down as: 1-50 (small), 51-250 (medium), 251-1000 (mid-market), 1000+ (enterprise). For competitive analysis, focus on employee-to-revenue ratios within the same industry—software companies average $200K-500K per employee, while retail averages $50K-150K.