- Stop Guessing What Fair Pay Looks Like, Here's What the Data Actually Shows
- Why Most Compensation Structures Have a Hidden Equity Problem
- Stop Losing Talent to Offers You Did Not See Coming
- What "Pay Equity" Actually Means for HR and Comp Teams
- The Problem with Traditional Salary Surveys (And Why They Keep Failing You)
- From "We Need to Benchmark" to a Defensible Pay Range: The Real-Time Workflow
- How a Healthcare Enterprise Used Live Job Data to Fix Its Pay Structure in Days, Not Months
- Why Pay Transparency Laws Are Making Real-Time Compensation Data Non-Negotiable
- Building a Defensible Pay Structure: The Pay Equity Analytics Workflow
- The Cost of Getting Pay Equity Wrong Has Never Been Higher: Here Is How to Get It Right
- Pay Equity Analytics Only Works When the Data Is Right
Stop Guessing What Fair Pay Looks Like, Here’s What the Data Actually Shows
Most companies want to pay people fairly. The problem is not intention it is information. The compensation data that HR and people analytics teams rely on is usually 12 to 18 months old by the time it reaches a spreadsheet, and in a labor market where pay expectations shift faster than survey cycles can keep up with, that lag has real consequences. Roles get under-benchmarked. Pay gaps quietly widen. And when employees start comparing notes or when regulators start asking questions the cracks become very expensive to fix.
This article walks through how real-time job data solves that problem in a way traditional salary surveys simply cannot. You will see the concrete workflow that takes an HR team from “we need to benchmark our compensation structure” to a defensible, equitable pay range built in hours rather than months and how JobsPikr’s salary benchmarking tools make that possible, whether you are pulling raw data through the API or working directly inside the platform. We also cover how pay transparency legislation is making live data less of a nice-to-have and more of a compliance requirement, and what a genuinely fair pay structure looks like when it is built on current market signals rather than last year’s survey averages.
Why Most Compensation Structures Have a Hidden Equity Problem
Here is something most HR leaders already know but rarely say out loud: the salary bands your team is using to make hiring and promotion decisions today were probably built on data that is at least a year old. Maybe older. And in a labor market that has been anything but stable, that gap between when the data was collected and when it is being used is where pay inequity quietly takes root.
This is not a people problem. Most compensation teams are doing exactly what they were trained to do, pulling from reputable salary surveys, following established benchmarking processes, and building structures that felt defensible at the time. The issue is structural. Traditional compensation benchmarking runs on a cycle, and that cycle has a lag built into it that the market no longer has patience for.
The typical salary survey process works something like this: companies submit pay data through standardized templates, the survey provider cleans and validates the submissions, and the final report gets published somewhere between six and twelve months after the data was collected. By the time your comp team purchases that report, extracts the relevant benchmarks, and builds them into your salary structure, you are routinely working with numbers that are 12 to 18 months behind the current market. In a stable economy with predictable hiring patterns, that lag is manageable. In the kind of talent market most industries have been navigating, it is a liability.
What makes this especially damaging from a pay equity standpoint is that the lag does not affect everyone equally. When market rates for certain roles, technical roles, in-demand specializations, roles that skew toward specific demographics, move faster than your salary structure can keep up with, the people most likely to negotiate aggressively or receive competing offers are the ones whose compensation gets corrected. Everyone else drifts. Over time, that drift creates the exact pay disparities that equity audits are designed to surface, and that regulators are increasingly designed to penalize.
The regulatory environment is already moving in this direction faster than many organizations have prepared for. The EU Pay Transparency Directive, which EU member states are required to transpose into national law by June 2026, will require employers to provide pay information to job candidates before interviews and give employees the right to request data on average pay levels across gender groups. In the United States, salary range disclosure laws have already passed in states including California, New York, Colorado, and Washington, with more in progress. These are not distant compliance considerations. They are live requirements that make the quality of your compensation data a legal matter, not just an HR one.
The honest problem underneath all of this is that you cannot build an equitable compensation structure on top of inaccurate benchmarks. Pay equity analytics only works when the external reference points feeding your internal analysis actually reflect what the market looks like right now, not what it looked like when someone filled out a survey fourteen months ago. That is the gap that real-time job data closes, and it is the reason more compensation and people analytics teams are moving away from annual survey cycles as their primary benchmarking source.
Stop Losing Talent to Offers You Did Not See Coming
Real-time salary benchmarking gives your comp team the market intelligence to stay competitive, role by role, city by city.
What “Pay Equity” Actually Means for HR and Comp Teams
Pay equity gets thrown around a lot in HR conversations. And because everyone uses it slightly differently, it helps to be clear about what it actually means before getting into how real-time data improves it.
Equal Pay vs. Pay Equity- They Are Not the Same Thing
At its core, pay equity means that people doing the same or similar work get paid comparably, regardless of gender, race, age, or any other protected characteristic. That is the legal definition. But for comp specialists and people analytics managers, the real challenge goes well beyond passing an audit.
Equal pay and pay equity are not the same thing, and this distinction gets glossed over more often than it should. Equal pay means two people in the same role earn the same. Pay equity is bigger, it is about whether your entire compensation structure is fair across levels, functions, and demographic groups, and whether the salary bands you have built reflect what the market looks like today. You can clear an equal pay audit and still have a fundamentally broken comp structure if the benchmarks underneath it are outdated. That is the part most organizations do not catch until it is already a problem.
Pay Equity Analytics Is More Than a Checkbox Exercise
Done properly, pay equity analytics is three things working together. First, an internal audit of what you are currently paying across groups and job levels. Second, an external benchmarking exercise that checks your ranges against what the market is offering right now. Third, a regular review of how your compensation bands are built and whether they need updating. Most companies have some version of the first. The second and third are where the gaps tend to live and where real-time job data makes the biggest difference.
According to Payscale’s Compensation Best Practices Report, organizations that do not benchmark compensation at least annually are significantly more likely to report pay equity challenges and retention problems. And that is assuming annual benchmarking is enough in fast-moving talent markets, it often is not.
When Your Salary Structure Itself Becomes the Problem
There is something that internal audits tend to miss entirely: the difference between what a role is worth today versus what it was worth when your band was originally created. Skills move at different speeds in different industries. A salary structure that made sense two years ago may now be quietly underpaying people in roles where market demand has shifted. And those roles are rarely spread evenly across demographic groups which is how a data quality problem becomes a pay equity problem.
The bottom line is simple. Your pay equity analytics are only as good as the market data feeding them. Internal analysis tells you how your people compare to each other. It does not tell you whether the floor your whole structure is standing on is in the right place. That is what real-time job data is built to solve.
The Problem with Traditional Salary Surveys (And Why They Keep Failing You)
Most compensation teams did not choose salary surveys because they were the best tool available. They chose them because they were the only structured tool available. For a long time, that was fine. But the way labor markets move today has exposed just how much the traditional survey model was always working around a fundamental flaw and patching over it with methodology notes.
The Lag Problem Is Worse Than Most People Realize
Here is how the typical salary survey cycle works. Companies submit pay data through standardized templates, usually once a year. The survey provider spends months cleaning, validating, and packaging that data into a report. The report gets published, purchased, and eventually makes its way into a comp team’s benchmarking process. By that point, the data you are working with was collected somewhere between 12 and 18 months ago and that is on a good cycle.
In a stable market, that lag is annoying but workable. In a market where demand for certain skills moves sharply within a single quarter, it is genuinely damaging. You are essentially setting your salary structure based on a photograph of the market taken over a year ago and hoping the landscape has not changed too much since. Sometimes it has not. Increasingly, it has.
Self-Reported Data Has a Participation Problem Nobody Talks About
The lag is only part of the issue. The data quality underneath most salary surveys is shakier than the polished reports suggest. Traditional surveys rely on manual submissions from participating companies, which introduces two problems that rarely get discussed openly.
The first is that participation is voluntary, which means the companies contributing to a survey are not a representative sample of the market. They tend to skew toward larger, more established organizations that have the bandwidth to fill out detailed compensation templates. Growth-stage companies, AI-native firms, and newer market entrants often the ones setting the most aggressive comp benchmarks are underrepresented or missing entirely. If those are the organizations you are competing against for talent, the survey data is not capturing your actual competitive set.
The second is accuracy. Self-reported data is only as reliable as the person filling in the form, and compensation data entry is rarely anyone’s top priority during a busy HR cycle. According to Mercer’s Global Talent Trends Report, data quality and consistency remain among the top concerns HR leaders cite when evaluating compensation benchmarking sources. That concern is not unfounded.
Small Sample Sizes Make the Numbers Noisy
Beyond participation bias, there is a sample size problem that becomes especially visible when you try to benchmark specialized or emerging roles. A salary survey with a few thousand respondents spread across industries, geographies, and job levels produces thin slices of data for any specific role in any specific market. The margin of error on a benchmark built from 40 or 50 data points for a niche technical role in a mid-sized city is wide enough to drive a significant compensation decision in the wrong direction.
The Institute for Women’s Policy Research has noted that pay equity gaps are most persistent in roles and industries where compensation data is least transparent and hardest to verify externally. That is not a coincidence. When the benchmarking data is thin, the people with the most leverage to negotiate who are not evenly distributed across demographic groups are the ones who capture the upside. Everyone else gets anchored to an average that may not reflect market reality.
The Result: Comp Bands That Are Outdated Before You Even Publish Them
Put the lag, the participation bias, and the sample size issues together and you get compensation bands that are built on a shaky foundation from day one and that foundation only gets shakier as the months pass. By the time a salary structure built on last year’s survey data reaches its annual review, it has often already drifted out of sync with the market in ways that are invisible until they show up as declined offers, retention conversations, or a pay equity audit that surfaces gaps you did not expect.
This is not an argument against using salary surveys entirely. For broad directional benchmarking in stable, well-documented roles, they still have a place. But for compensation decisions that need to hold up in a fast-moving market and increasingly, in front of regulators they cannot be your primary source. That is where real-time job data changes the equation entirely.
From “We Need to Benchmark” to a Defensible Pay Range: The Real-Time Workflow
Here is the honest version of how most compensation benchmarking gets done today. An HR analyst gets a request to review salary bands for a handful of roles. They pull up the most recent survey report sitting in a shared drive, extract the relevant percentiles, apply a location adjustment factor, and build a pay range that looks reasonable on paper. The whole thing takes a few days. And by the time it feeds into a hiring decision or a comp review cycle, the underlying data is anywhere between 12 and 18 months old.
That is not negligence. That is what the traditional process looks like. But it is also exactly why compensation structures drift out of sync with the market and why pay equity gaps appear in places no one was looking.
Real-time job data changes that workflow in a fundamental way. Instead of working backward from a published report, your comp team starts from what employers are actively advertising right now, role by role, city by city, seniority level by seniority level. The difference is not just speed. It is the quality of the signal. A salary range posted by a company with an open role and a hiring deadline is a much more honest reflection of market intent than a number that went through a survey intake form six months ago.
Here is how the two approaches compare at every step:
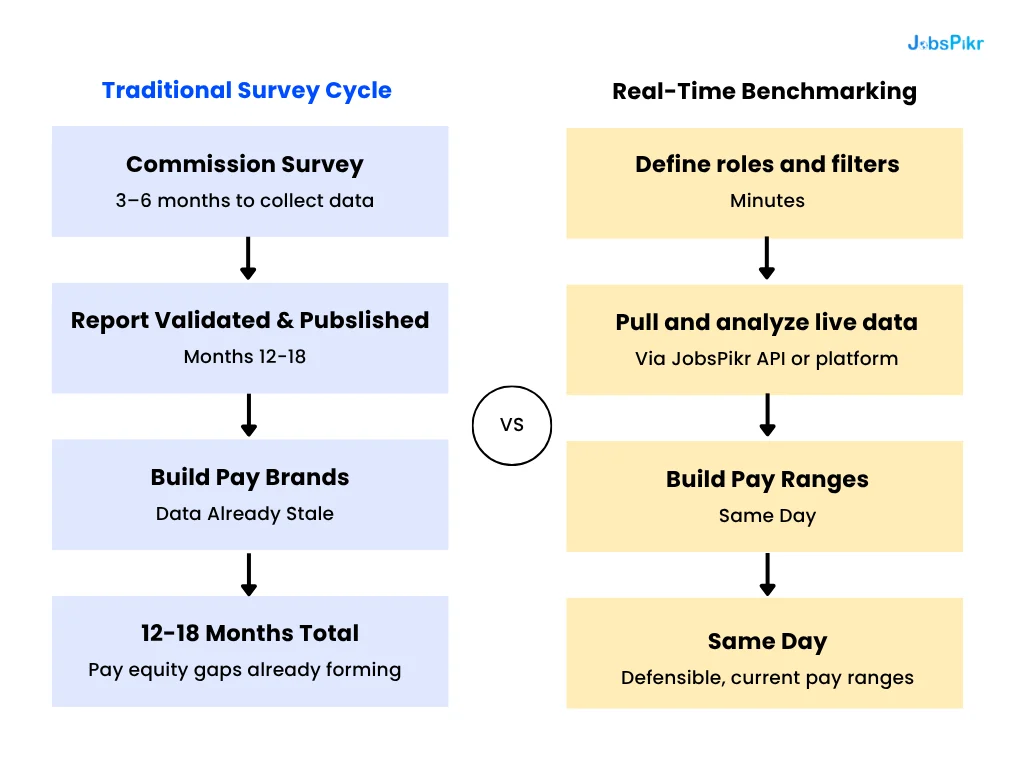
How the JobsPikr Workflow Actually Works
The right side of that diagram might look deceptively simply. Three steps and you have live pay ranges, so what is happening under the hood?
JobsPikr ingests job postings from across the web in real time, normalizing role titles, salary disclosures, location data, seniority signals, and skill requirements into a clean, queryable format. That normalization work is what makes the data useful. Raw job posting data is messy, the same role might be titled “Senior Compensation Analyst,” “Lead Comp Specialist,” or “People Analytics Manager (Comp)” across three different postings. JobsPikr maps those to consistent role categories so your query returns an apples-to-apples dataset rather than a noisy mix.
Once your filters are set, role, geography, industry, seniority band, you get back a distribution of what employers are actively offering right now. Not what they reported on a survey. Not what they would have said if someone had asked them twelve months ago. What they are advertising to candidates today, with a hiring budget attached to it.
That distribution is the foundation your pay equity analytics should be built on. You can see the floor, the ceiling, the 25th percentile, the median, and the 75th percentile, all segmented by the variables that matter for your specific roles. And because the data refreshes continuously, running the same query next quarter gives you a genuinely updated picture rather than the same stale numbers with a new date on the cover.
What This Looks Like in Practice
JobsPikr works two ways, and which one fits depends on how your team operates. HR analysts and compensation specialists working inside the platform can filter and explore salary benchmarking data directly, without writing a line of code. HR tech teams and people analytics managers who want to integrate live comp data into existing workflows, applicant tracking systems, HRIS platforms, internal compensation analytics tools, can pull it programmatically through the API.
Both paths lead to the same output: current, role-specific salary data that supports a compensation structure built on what the market looks like today.
Watch the demo below to see exactly how the salary benchmarking workflow runs inside the platform:
How a Healthcare Enterprise Used Live Job Data to Fix Its Pay Structure in Days, Not Months
Let’s make this concrete. The workflow diagram in the previous section is useful, but nothing lands quite like seeing it play out in a real scenario. Here is how a mid-to-large healthcare organization might use JobsPikr to go from a pay equity problem to a defensible compensation structure in a matter of days.
The Situation
Meet Meridian Health Systems a fictional but realistic 7,000-person healthcare enterprise operating across multiple states in the US. They have a mix of clinical staff, operations teams, and a growing data and technology function that has expanded significantly over the last three years as the organization invested in health informatics, AI-assisted diagnostics, and patient data platforms.
Their comp team two compensation specialists and a people analytics manager had been relying on an industry salary survey that was refreshed annually. On paper, that sounded reasonable. In practice, the survey data they were working from had been collected nearly fourteen months before their most recent compensation review cycle. For their nursing and administrative roles, the lag was manageable. For their data engineering, ML, and health informatics roles, it was a serious problem.
The trigger came during a mid-year retention review. Three data engineers and one health informatics lead had left within a six-month window. Exit interviews pointed loosely toward “better opportunities,” but the people analytics manager suspected the real issue was compensation. When she started pulling external offer data from candidates who had declined Meridian’s offers, the picture became clear: Meridian was offering salaries that were sitting at the 40th to 45th percentile of the current market for those roles. They thought they were at the median. They were not close.
The Problem With Their Existing Benchmarks
The survey their team had been using was well-regarded and methodologically sound. But it had two problems that are common across traditional benchmarking sources. First, the healthcare industry sample skewed heavily toward large non-profit hospital systems, which historically pay below the market rate for technical talent. Meridian was competing for data engineers and ML talent against healthtech startups and digital health companies none of which were well-represented in the survey. Second, the data had been collected before a notable acceleration in demand for health informatics talent, which had pushed market rates for those roles up meaningfully in the twelve months since.
The comp team was benchmarking against the wrong competitive set, using data that predated the market shift they were trying to respond to. That combination is exactly how a pay equity problem quietly compounds.
What They Did Differently
The people analytics manager pulled Meridian’s five most at-risk technical roles Data Engineer, Health Informatics Analyst, ML Engineer (Clinical), Senior Data Analyst, and Clinical Data Architect and ran each one through JobsPikr’s salary benchmarking tool. She filtered by geography across the three states where Meridian had the highest concentration of technical staff, set seniority bands to match their internal levels, and pulled results segmented by company type to separate healthtech and digital health employers from traditional hospital systems.
The difference in what came back versus what their survey had told them was significant.
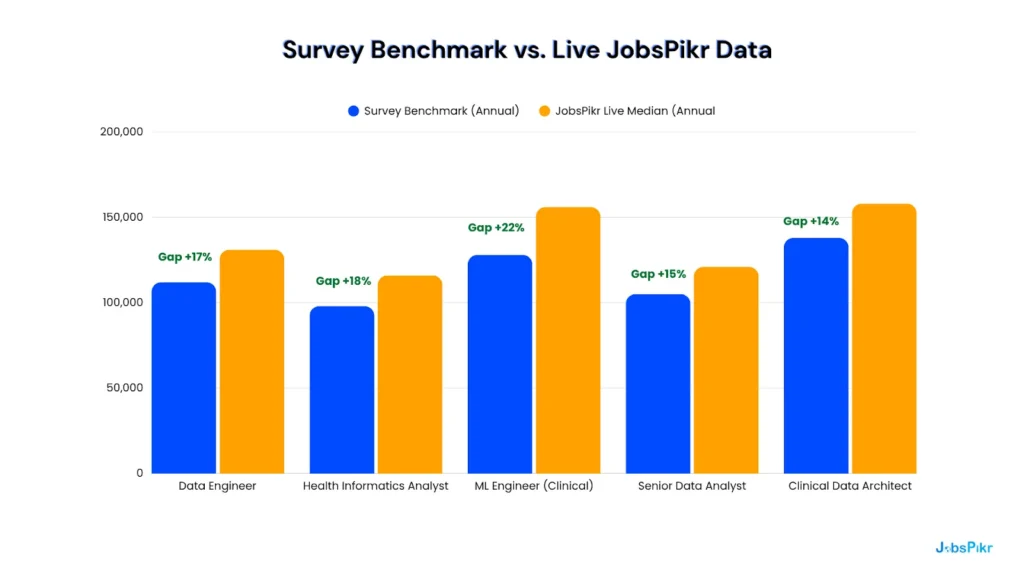
Across all five roles, the live job posting data showed market rates running 12 to 22 percent above what Meridian’s survey benchmarks had indicated. The gap was widest for the ML Engineer (Clinical) role a specialization where demand had outpaced supply considerably and where the survey’s sample size had been thin enough to make the benchmark unreliable anyway.
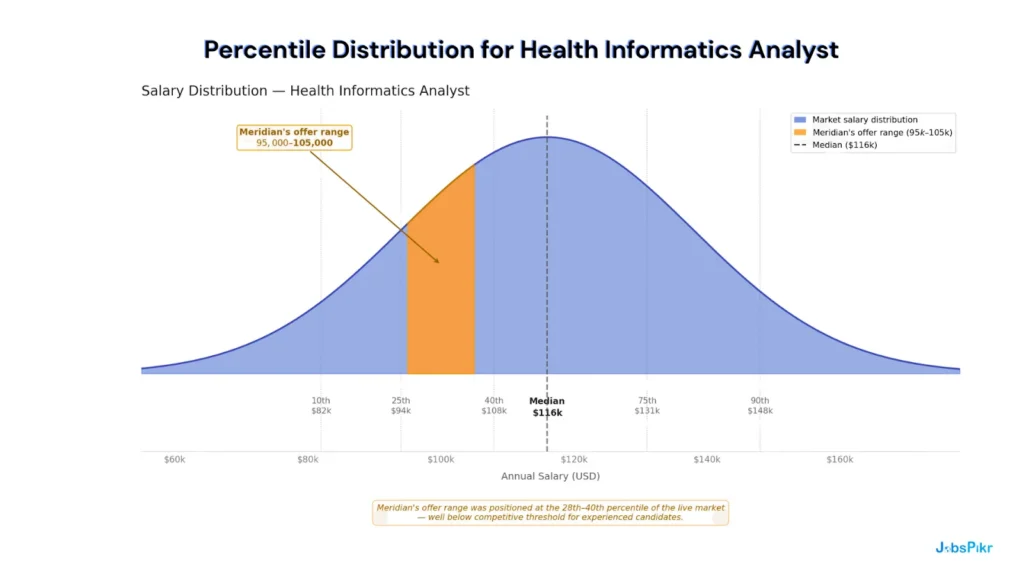
What the distribution view made clear was not just that Meridian was underpaying. It was that their offers were landing in a range that candidates with more than two years of experience were consistently rejecting in the current market. The 40th percentile positioning that felt conservative but reasonable a year ago had become a structural barrier to hiring.
Building a Defensible Pay Range In Hours
With the live data in hand, the comp team rebuilt salary bands for all five roles within a single working day. That is not an exaggeration it reflects what changes when you replace a multi-month survey procurement cycle with a direct query against a live dataset.
The new bands were anchored at the 50th percentile of current market postings for each role, with a stated range spanning the 40th to 70th percentile to allow for seniority variation within the level. More importantly, the bands were now calibrated against the right competitive set: employers that Meridian was losing candidates to, not hospital networks with structurally different comp philosophies.
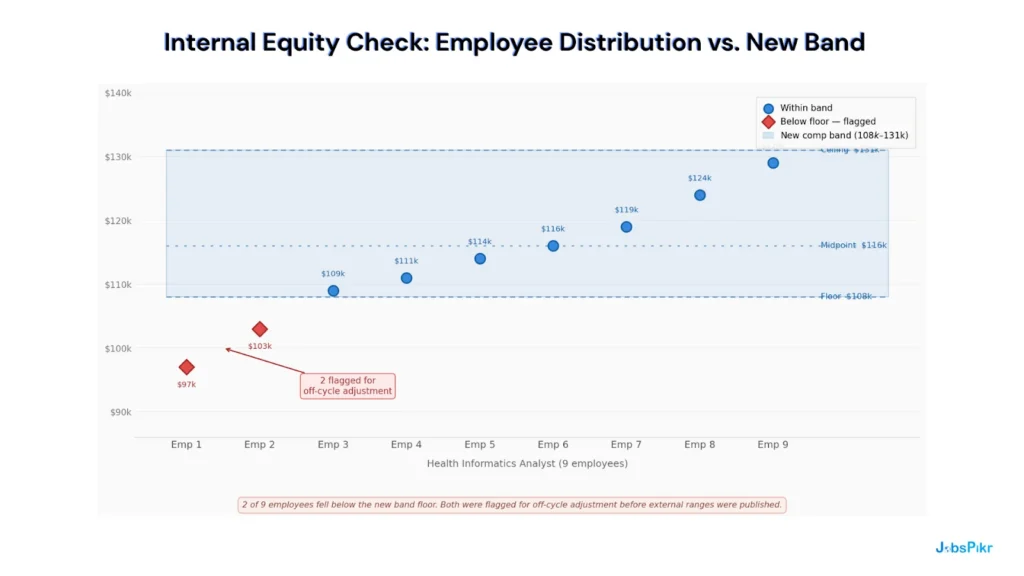
The people analytics manager also used the data to run a quick internal equity check comparing what current Meridian employees in those roles were earning against the newly benchmarked ranges. That check surfaced two employees who had fallen below the new band floor due to years of modest merit increases that had not kept pace with market movement. Both were flagged for an off-cycle adjustment before the new external bands were published.
What Changed as a Result
Within the next two hiring cycles, Meridian’s offer acceptance rate for technical roles improved noticeably. Time-to-fill for their data engineering roles, which had been stretching beyond 90 days, came back down as offers became competitive enough to close candidates who had previously been running parallel processes. The two employees identified in the internal equity check received adjustments that, according to their managers, visibly shifted their engagement in the following quarter.
None of that required waiting for the next annual survey cycle. It required switching the data source.
According to Mercer’s 2024 Global Talent Trends, organizations that use real-time labor market data for compensation decisions report significantly faster hiring cycle times and stronger internal pay equity outcomes than those relying solely on annual surveys. Meridian’s experience reflects exactly that pattern.
Image Alt: Outcomes summary showing improved offer acceptance rates and reduced time-to-fill after switching to real-time job data for compensation benchmarking
The specifics here are fictional. The dynamics are not. This is the workflow that HR teams at mid-to-large enterprises are increasingly moving toward not because real-time data is a shiny new tool, but because the cost of working with stale benchmarks has become too visible to ignore.
Why Pay Transparency Laws Are Making Real-Time Compensation Data Non-Negotiable
For a long time, pay transparency felt like something organizations could choose to engage with on their own terms. A progressive employer might publish salary bands voluntarily. A more traditional one might not. Either way, it was largely a culture decision rather than a compliance requirement.
That window is closing fast.
The Regulatory Shift That Changes Everything
The EU Pay Transparency Directive is the most significant piece of compensation legislation in a generation. EU member states are required to transpose it into national law by June 2026, and the obligations it creates are not minor adjustments. Employers will be required to disclose salary information to candidates before the interview stage, give employees the right to request average pay data broken down by gender across comparable roles, and for organizations with 100 or more employees publish regular pay gap reports. Companies found to have a gender pay gap of 5 percent or more that cannot be objectively justified will be required to conduct a joint pay assessment with employee representatives.
That last point is worth sitting with. It is not enough to say the gap exists for legitimate reasons. You must be able to demonstrate it, with data, to the people affected by it. That is a fundamentally different standard than most enterprises are currently operating to.
In the United States, the picture is more fragmented but moving in the same direction. Pay transparency laws requiring salary ranges in job postings are now in effect in California, New York, Colorado, Washington, Illinois, and several other states, with more legislation in progress. Canada and Australia have introduced or are actively developing similar frameworks at the federal and state level respectively.
More Disclosed Salaries Means Better Benchmarking Data
There is a practical upside to this regulatory wave that does not get discussed enough. As more companies are legally required to include salary ranges in job postings, the quality and coverage of live job posting data improve significantly. According to LinkedIn’s Global Talent Trends Report, the share of job postings including salary information has grown substantially year over year as pay transparency legislation expands across the US and Europe a trend that shows no signs of slowing down. That means the dataset available for live benchmarking purposes gets richer and more representative with every passing quarter.
For organizations using JobsPikr to benchmark compensation, this is a direct tailwind. More disclosed ranges in postings means the dataset gets richer and more representative with every passing quarter. The same platform that is useful today becomes more powerful as transparency legislation expands the pool of postings that carry usable salary data.
Compliance and Competitiveness Now Require the Same Thing
Here is the part that should matter most to HR leaders and people analytics teams: the data infrastructure you need to stay compliant with pay transparency regulations is the same infrastructure you need to stay competitive in the talent market. They are not separate workstreams.
To comply with the EU, Pay Transparency Directive, you need to be able to demonstrate that your pay ranges are grounded in objective, current market data not just internal precedent or historical survey benchmarks. That requires live compensation data, regularly refreshed, and connected to a clear methodology. That is exactly what a real-time benchmarking workflow built on job posting data provides.
The organizations that will navigate the next two years most smoothly are the ones that treat pay transparency compliance as an opportunity to build better compensation infrastructure, not as a reporting burden to manage around. The ones that try to retrofit old benchmarking processes to new regulatory requirements will find themselves constantly catching up.
Real-time job data does not just make your pay equity analytics more accurate. It makes your compensation decisions defensible, in front of candidates, in front of employees, and increasingly, in front of regulators.
Building a Defensible Pay Structure: The Pay Equity Analytics Workflow
Getting to an equitable compensation structure is not a one-time project. That is the thing most organizations get wrong about it. They treat it like a renovation, something you do once, step back from, and admire until the next major overhaul. A pay structure that holds up over time looks less like a renovation and more like a maintenance schedule. It requires regular inputs, a clear process, and a data source that does not go stale between cycles.
Here is what that looks like in practice.
Start With Role Clarity Before You Touch the Numbers
The most common reason salary benchmarking produces bad outputs is not bad data, it is bad role definitions going into the query. If your job architecture is fuzzy, your benchmarks will be too. A job title like “Data Analyst” can describe a junior reporting analyst pulling weekly dashboards or a senior analytics engineer building the data infrastructure that the rest of the business runs on. If those two roles are being benchmarked against the same external dataset, the resulting pay range is not useful for either of them.
Before you run a single query against live job posting data, make sure the roles you are benchmarking are defined clearly enough that the external data you pull back is comparable to what you are hiring for. That means being specific about seniority level, core responsibilities, and the skill requirements that genuinely differentiate one level from the next. The more precise your input, the more defensible your output.
Build Bands from Distributions, Not Single Numbers
A salary benchmark is not a number. It is a distribution. And the way you use that distribution to build a pay band matters enormously for both competitiveness and internal equity.
A well-constructed pay band for most professional roles should anchor its midpoint at the 50th percentile of the current market for that role in your relevant geography and competitive set. The floor of the band typically sits around the 40th percentile, low enough to accommodate newer employees still building toward full proficiency, but not so low that you are structurally underpaying people who have been in the role for two or more years. The ceiling usually lands around the 65th to 70th percentile, leaving room for high performers without creating a ceiling that immediately compresses against the next level.
What live job data adds to this that surveys cannot is the full shape of the distribution. You are not just seeing the median, you are seeing how spread out or compressed the market is for that role right now. A role where the 25th and 75th percentiles are $20,000 apart tells you something very different about market dynamics than one where they are $60,000 apart. That spread affects how you set your band width, how much flexibility you build into your offer process, and how quickly your bands need to be reviewed when the market moves.
Make Internal Equity a Built-In Step, Not an Afterthought
One of the most valuable things you can do with live benchmarking data is not just compare your bands to the market, but also compare your current employees to your newly updated bands before you publish them externally. This is the internal equity check, and it is the step that most organizations skip because it is uncomfortable.
Skipping it is expensive. When you update pay bands based on new market data and do not check whether existing employees have fallen below the new floor, you create a situation where a new hire walks in earning more than someone who has been doing the same job effectively for three years. That gap rarely stays hidden for long, and when it surfaces, it becomes a retention and trust problem simultaneously.
The internal equity check does not need to be a lengthy process. With your updated bands in hand and your current compensation data pulled from your HRIS, you can identify employees below the new band floor within hours. The ones who need adjustment should be flagged for an off-cycle review before the new bands go live. That sequencing, fix internally first, publish externally second, is the difference between a compensation update that builds trust and one that quietly creates new problems.
Set a Refresh Cadence That Matches How Fast Your Market Moves
Not every role needs to be benchmarked every quarter. But some roles do and knowing which ones requires paying attention to how fast the market for specific skills is moving.
For stable, well-documented roles where market rates shift gradually, think general operations, finance, or administrative functions, an annual benchmarking refresh is probably sufficient. For technical, specialized, or high-demand roles where market rates have been moving meaningfully year over year, a semi-annual or even quarterly check against live posting data is worth building into your process. The cost of running that check with a live data platform is low. The cost of missing a significant market shift in a role where you are actively hiring or struggling to retain is not.
A practical way to trigger an unscheduled review is to track your offer acceptance rate and time-to-fill by role category. If either metric starts drifting in the wrong direction for a specific role, that is a signal worth investigating before it becomes a pattern. Live job data lets you run that check in hours rather than waiting for the next survey cycle.
Connect Your Pay Equity Analytics to a Repeatable Workflow
The organizations that build genuinely equitable compensation structures over time are not necessarily the ones with the biggest HR teams or the most sophisticated technology. They are the ones who treat pay equity analytics as a repeatable workflow rather than a periodic audit.
That workflow looks like this: live market data feeds updated salary bands on a defined refresh cycle. Updated bands feed an internal equity check against current employee compensation. The equity check flags anyone below the new floor for review before external bands are published. Offer data from recent hiring cycles feeds back into the analysis to validate that your bands are landing where you think they are. And the whole process is documented clearly enough that you can explain it, to leadership, to employees, and if necessary, to regulators.
That last point matters more than it used to. As pay transparency requirements expand, the ability to show your methodology is becoming as important as the outcome it produces. A pay range backed by a clear, current, data-driven process is defensible. One that traces back to a survey report from eighteen months ago, applied with a spreadsheet and a gut check, is not.
The Cost of Getting Pay Equity Wrong Has Never Been Higher: Here Is How to Get It Right
There is a version of this problem that used to be easy to ignore. Pay gaps existed, compensation structures drifted, and if no one was asking too many questions, the consequences stayed below the surface. That version of the problem is gone.
Employees are more informed about market rates than they have ever been. Regulators in the US, Europe, and beyond are introducing requirements that put the burden of proof on employers. And the talent market has moved fast enough in the last two years that a compensation structure built on last year’s data is not a conservative choice, it is an active liability.
The good news is that the path to a more equitable, defensible pay structure has never been more accessible either. Real-time job data has changed what is possible for HR teams and compensation specialists who previously had no choice but to wait for the next survey cycle. The ability to pull live salary benchmarks by role, geography, seniority, and industry and to turn those benchmarks into updated pay bands within a single working day is not a feature reserved for the largest enterprises with the deepest HR tech budgets. It is available now, and the organizations using it are making faster, more confident, and more defensible compensation decisions as a result.
Pay equity analytics is not a project with a finish line. It is an ongoing function that gets better when it is fed better data. That shift, from treating compensation benchmarking as an annual exercise to treating it as a live, continuous input to your people strategy, is the one that separates organizations that consistently attract and retain the right talent from the ones that are always catching up to a market that moved while they were waiting.
JobsPikr exists to close that gap. With over 100 million job postings tracked in real time, it gives compensation teams the signal they need to build pay structures that hold up, not just now they are built, but every quarter after that.
Pay Equity Analytics Only Works When the Data Is Right
Give your HR team the real-time benchmarking foundation every compensation decision deserves.
Frequently Asked Questions
1. What are the core components of a robust pay equity analysis?
A solid pay equity analysis has three parts that need to work together. The first is an internal audit a structured review of what you are currently paying across roles, levels, and demographic groups to identify where gaps exist. The second is external benchmarking, which means comparing your compensation ranges against current market data to establish whether your bands are grounded in what the market looks like today. The third is a structural review of how your pay bands are built and maintained, including how often they are refreshed and whether your job architecture is precise enough to make benchmarking meaningful. Most organizations have some version of the internal audit. The external benchmarking and structural review are where the gaps tend to live and where real-time job data makes the biggest difference. Without current, role-specific market data feeding your analysis, you are measuring your internal pay decisions against a benchmark that may no longer reflect reality.
2. How do you use analytics platforms to identify pay disparities across job roles?
The most effective way to use an analytics platform for identifying pay disparities is to work in two directions at once inward and outward. The inward view pulls your current employee compensation data and segments it by role, level, tenure, location, and demographic group to surface where gaps exist internally. The outward view pulls live market data for the same roles and levels to establish where your bands should be sitting relative to the current market. The disparity you are looking for is not just between employees it is between what you are paying and what the market is offering for comparable work right now. Platforms like JobsPikr give compensation teams access to live salary data from millions of active job postings, segmented by role, geography, seniority, and industry, so the external reference point you are measuring against reflects what employers are actively offering today rather than what they reported on a survey over a year ago.
3. What are the best software tools for pay equity analytics in HR departments?
The right combination of tools depends on what part of the pay equity problem you are solving. For internal analysis auditing what your current employees earn and identifying gaps across groups most mid-to-large enterprises use their HRIS platform as the starting point, supplemented by people analytics tools that can slice and segment compensation data by the variables that matter. For external benchmarking understanding what the market is paying for the same roles right now you need a data source that is current enough to be useful. That is where traditional salary survey platforms fall short and where real-time job data platforms like JobsPikr fill the gap. JobsPikr tracks over 100 million job postings in real time, giving HR analysts and compensation specialists live salary benchmarks by role, location, seniority, and industry. For enterprises that want to integrate live compensation data directly into existing workflows or HRIS systems, JobsPikr also provides API access so the data feeds into the tools your team is already using.
4. How do companies conduct an internal pay equity audit?
An internal pay equity audit typically starts with pulling a clean extract of your current compensation data base salary, total cash, and any variable pay components mapped to role, level, location, tenure, and demographic group. The next step is grouping employees into comparable cohorts: people doing substantially similar work at the same level in the same geography. Within each cohort, you look for statistically meaningful pay differences that cannot be explained by legitimate, documented factors like performance rating, time in role, or specific skill differentials. The gaps that remain after accounting for those factors are your equity findings. The step most organizations skip or do too late is running that internal analysis against a current external benchmark before publishing any updated pay ranges. If your band floors have drifted below the current market rate, fixing the internal gaps without also updating the bands just moves the problem rather than solving it. A complete audit addresses both simultaneously.
5. What data points are essential for effective pay equity analytics?
Effective pay equity analytics requires two categories of data working together. Internally, you need base salary and total compensation by employee, mapped to role title, job level, department, location, tenure, performance rating, and demographic information where legally permissible to collect. Those data points let you identify gaps within your own organization. Externally, you need current market salary data segmented by role, seniority level, geography, and industry not survey averages from twelve months ago, but what employers are actively offering right now. The external data is what tells you whether your band floors and midpoints are grounded in market reality or whether they have drifted. Without both sides of that picture, pay equity analytics gives you an incomplete answer. You might identify that two employees in the same role are paid differently, but without external benchmarks you cannot tell whether either of them is being paid fairly relative to the market which is ultimately the standard that matters most for retention, competitiveness, and increasingly, regulatory compliance.