- Wage Inflation Is Moving Faster Than Your Comp Data Can Keep Up
- Wage Inflation Is Not What It Used to Be
- Make Every Offer With Market Data Behind It
- Why Your Compensation Analytics Are Flying Blind
- Posting Velocity as a Wage Inflation Signal: The Metric Most Teams Miss
- Which Roles Are Seeing the Sharpest Wage Inflation in 2026
- Wage Growth vs. Inflation: What the Numbers Actually Mean for Headcount Planning
- How Real-Time Compensation Analytics Changes What You Can Actually Do
- Your Wage Inflation Response Starts With Better Compensation Data
- Stop Benchmarking with Data That's Already a Year Old
- Frequently Asked Questions
Wage Inflation Is Moving Faster Than Your Comp Data Can Keep Up
Most finance and HR leaders are tracking wage inflation with tools that were built for a slower world. Annual comp surveys, ECI reports, and peer benchmarking exercises all have their place, but by the time that data reaches your planning cycle, the market has already moved. In some roles, it has moved a lot.
This article uses real job posting data from JobsPikr’s pipeline, which processes over 2.3 million job signals daily across 100+ countries, to show where wage inflation is hitting hardest in 2026. Not where economists expect it to hit. Where it already has.
Here is what you will find: why posting velocity is the early warning signal most comp teams are not watching, which roles across tech, healthcare, finance, and logistics have seen the sharpest salary movement from 2024 to 2025, how to read wage growth versus inflation in a way that is actually useful for headcount planning, and what real-time compensation analytics makes possible that annual survey data simply cannot.
If your team is still setting comp bands on a once-a-year refresh cycle, this piece will show you exactly what that lag is costing, and what a more responsive approach looks like in practice.
Wage Inflation Is Not What It Used to Be
There was a time when tracking wage inflation meant watching two or three macro indicators and adjusting your comp bands by a modest percentage each year. You checked the Consumer Price Index, glanced at the Employment Cost Index, and stayed roughly in step with the market. Clean, predictable, manageable.
That approach has not kept up with what the labor market is actually doing.
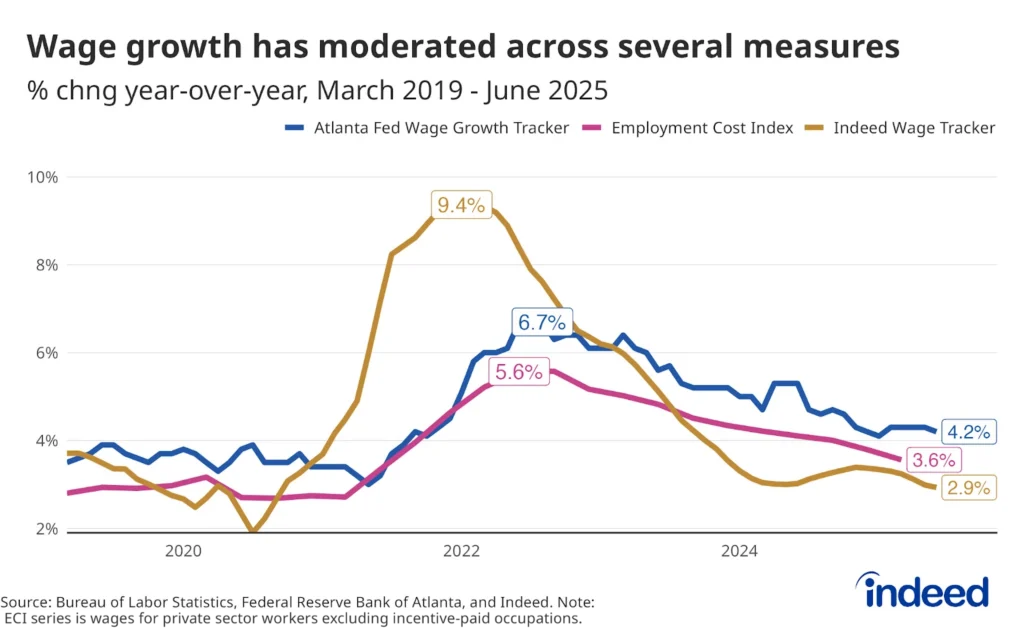
Image Source: Hiringlab
The problem is not that wage inflation has disappeared. It has fragmented. Broad economic indices still show relatively moderate overall wage growth, with the US Employment Cost Index for private sector wages growing 3.3% year over year as of December 2025, according to the Bureau of Labor Statistics. But that headline number masks enormous variation underneath it. Some roles are seeing salary movement of 10, 15, or even 20 percent over the same period. Others are flat or declining. An average that blends all of that is not a useful planning tool. It is noise.
Why Your Salary Benchmarks and the Real Market Are Telling Different Stories
This is the distinction that most workforce planning conversations skip over, and it is the one that causes the most damage to comp strategy.
Macroeconomic wage inflation measures the average cost of labor across the entire economy. Talent market wage inflation measures what is happening to the specific roles you are trying to hire and retain. In a stable, evenly growing market, those two numbers move roughly together. In the market that has emerged since 2021, they have decoupled significantly.
“A 3.3% average wage growth figure tells a CFO almost nothing useful about what they need to budget for a Nurse Practitioner hire, an AI Engineer offer, or a Supply Chain Manager retention package. Those roles are living in completely different compensation realities.”
The practical implication is straightforward but uncomfortable. If your headcount budget is built on macro wage growth assumptions, it is probably wrong for your most critical roles, and not by a small margin.
Talent Scarcity Is the Real Engine Behind Role-Level Wage Inflation
At the role level, wage inflation is almost entirely a supply and demand story. When demand for a specific skill set outpaces the available supply of people who have it, employers start offering more to win the hire. When enough employers do that simultaneously, the market rate moves. That movement shows up in job postings before it shows up in salary surveys, because postings reflect live hiring intent, not retrospective reporting.
Three conditions consistently accelerate this process. First, when a skill becomes newly critical to business operations and the talent pipeline has not caught up yet, think of cybersecurity after a wave of high-profile breaches, or AI engineering as enterprises move from experimentation to production. Second, when demographic pressure reduces available supply independent of demand, which is exactly what is happening in healthcare as an aging workforce exits and patient volumes grow simultaneously. Third, when remote hiring expands the competitive set from local to global, pushing offers higher across the board.
Compensation Strategy Now Has a Shorter Shelf Life
The speed at which role-level wage inflation can move has increased. Labor market data is more accessible than it has ever been. Candidates know what the market is offering. Recruiters at competing firms know what you are offering. The information asymmetry that used to give employers a buffer before a market shift became visible has largely disappeared.
The result is that compensation strategy ages faster than it used to. A comp band built carefully in Q1 may be meaningfully out of market by Q3 for high-demand roles. That is not a hypothetical. It is what the posting data from the last three years consistently shows, and it is the core reason why the way most organizations currently run compensation analytics is no longer fit for purpose.
Make Every Offer With Market Data Behind It
Role-specific, location-specific compensation intelligence for workforce planners and HR leaders who cannot afford to get it wrong.
Why Your Compensation Analytics Are Flying Blind
Most comp teams are not making bad decisions because they lack effort or expertise. They are making bad decisions because the data they are working with has a structural lag built into it that nobody talks about openly enough.
Here is how the typical compensation review cycle works. A survey vendor collects submissions from participating employers, usually through a manual intake process that runs over several weeks. The data gets cleaned, validated, and packaged into a report. That report gets purchased, distributed internally, and eventually lands in the hands of the person setting comp bands, often six to twelve months after the underlying data was collected. In a stable labor market, that lag is a minor inconvenience. In the market that has been running since 2021, it is a genuine liability.
When Survey Data Becomes a Liability, Not a Benchmark
The structural problem with annual salary surveys goes beyond just timing. It is also about who participates.
Most major compensation surveys draw their submissions from large, established enterprises, the kinds of companies with dedicated comp teams and the bandwidth to complete a detailed intake process every year. That means the resulting benchmarks systematically underrepresent what growth-stage companies, AI-native firms, and high-growth healthcare organizations are paying, which are often the exact competitors you are losing candidates to. You are benchmarking against a peer set that does not reflect your actual competitive landscape.
There is also a participation incentive problem that rarely gets discussed. Companies that are paying above market have less reason to disclose that openly in a survey. Companies paying at or below market are more likely to participate because the resulting benchmarks validate their existing ranges. The data skews conservative before it even gets to you.
“By the time a compensation survey is commissioned, completed, cleaned, published, purchased, and applied to a real hiring decision, the market it was measuring may have moved through two or three meaningful shifts.”
Self-Reported Platforms Have the Same Problem, Just Faster
Platforms built on employee-reported salary data solve the timing problem partially, but introduce a different one. Self-reported numbers are subject to recall bias, status inflation, and inconsistent role definitions. When an employee reports their salary on a crowdsourced platform, there is no validation of their actual title, seniority level, total comp structure, or the market they are operating in. The result is a dataset that feels granular but is actually quite noisy, especially for specialized or senior roles where sample sizes are thin.
For roles where the sample is large enough, like software engineers in major US cities, these platforms can give you a reasonable directional read. For roles that are newer, more specialized, or concentrated in specific industries, the data thins out quickly, and the ranges become too wide to be actionable.
What Flying Blind Actually Costs You
The cost of stale compensation data is not abstract. It shows up in specific, measurable ways that most organizations attribute to other causes.
Offer decline rates creep up without a clear explanation from candidates, because comp is rarely the stated reason, even when it is the real one. Time-to-fill stretches for high-demand roles as candidates run parallel processes and accept faster elsewhere. Retention conversations start happening earlier in tenure as existing employees learn what the market is currently offering their skill set. Each of these is a symptom of a compensation strategy that is lagging the market, and each one carries a real cost that compounds over time.
According to the Society for Human Resource Management (SHRM), the average cost of replacing an employee ranges from 50% to 200% of their annual salary, depending on seniority and specialization. For a workforce planner or CFO, that math makes a strong case for investing in better real-time compensation data long before the retention problem shows up on a dashboard.
Posting Velocity as a Wage Inflation Signal: The Metric Most Teams Miss
Most compensation analytics tools tell you what salaries look like right now. Very few tell you where they are heading. Posting velocity, which is simply how fast job postings for a specific role are growing over time, is one of the clearest leading indicators of salary pressure that exists in labor market data. And most comp teams are not watching it.
The logic is straightforward. When employers start posting a role at an accelerating rate, it means demand is outpacing their ability to fill it. As more organizations compete for the same pool of candidates, offers go up. The salary spike does not happen the moment posting volume rises; it follows, usually by one to two quarters. That lag is the window where smart compensation analytics gives you an edge. If you can see the posting surge before the salary movement hits, you can adjust your comp bands proactively rather than reactively.
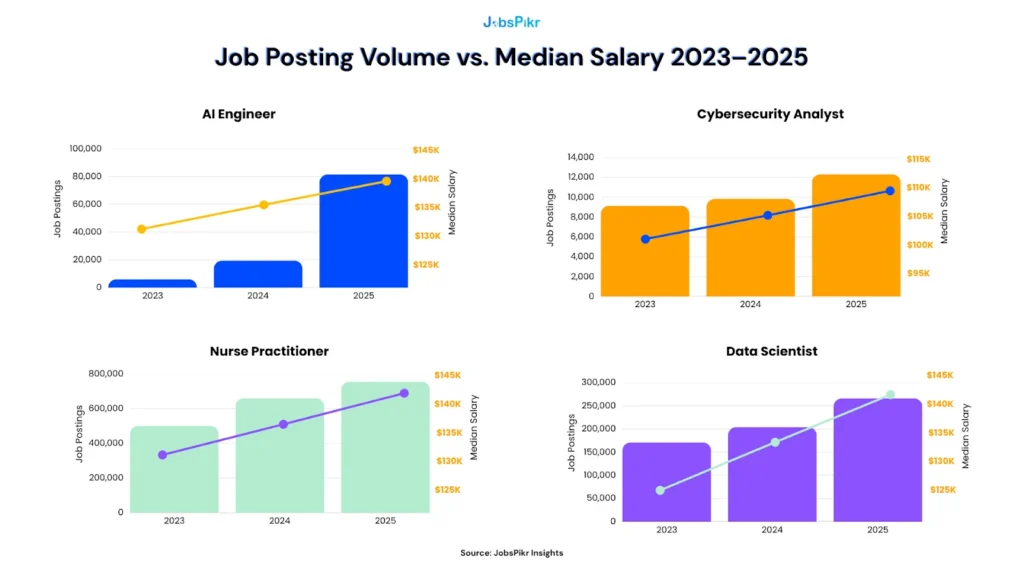
JobsPikr’s data across four high-demand roles makes this lead-lag relationship visible in a way that is hard to ignore.
What the Data Actually Shows
Here is how posting volume and median offered salary moved together from 2023 to 2025 across four roles tracked in JobsPikr’s pipeline.
Three Patterns Worth Paying Attention To
The AI Engineer numbers are the most dramatic in the dataset, and arguably the clearest illustration of posting velocity as a leading salary signal. Postings grew more than 13x from 2023 to 2025, jumping from 6,110 to 81,500. Salary moved steadily upward alongside that surge, from $131,000 to $139,000, but notice that the salary movement is measured and progressive rather than explosive. That is the market absorbing demand pressure gradually, which means the salary curve for this role likely has more room to run as posting volumes stay elevated. For any workforce planner with AI engineering headcount in their 2026 budget, this is not a role to benchmark once and file away.
The Cybersecurity Analyst pattern tells a different but equally important story. Posting growth here is steady rather than dramatic, rising from 9,140 to 12,300 over three years. But salary has moved consistently upward in step with it, from $101,000 to $109,000. This is what slow-burn wage inflation looks like. It does not trigger alarm bells the way a sudden spike does, which is exactly why it tends to get underestimated in annual comp reviews. By the time the cumulative movement shows up in a survey benchmark, you are already behind.
The Data Scientist data is the most nuanced of the four and is worth examining closely before concluding. Posting volume actually dropped sharply in 2024, falling from 500,000 to 204,000, before recovering to 266,000 in 2025. Despite that posting dip, median salary continued climbing through both years, from $125,000 to $134,000 to $141,000. What this tells you is that the posting volume correction in 2024 reflected a market recalibration, likely as companies became more specific about what they actually needed from data science hires, not a reduction in how much they were willing to pay for the right person. Salary pressure and posting volume can diverge, and when they do, watching only one of those signals will mislead you.
How to Use Posting Velocity in Your Planning Cycle
The practical application here is not complicated, but it does require a shift in how compensation reviews are structured. Instead of asking only “what is the market paying for this role today,” the more useful question is “how fast is posting volume for this role growing, and what does that suggest about where salary will be in two quarters?”
For CFOs building headcount budgets and CHROs setting total rewards strategy, this distinction matters enormously. A role where posting volume has tripled in twelve months is a role where your current comp band is likely to look underpowered before the fiscal year closes. Building that assumption into your budget now is considerably cheaper than making emergency market adjustments mid-cycle.
Which Roles Are Seeing the Sharpest Wage Inflation in 2026
Aggregate wage growth numbers are useful for economic commentary. They are not useful for setting a comp band. What actually matters to a workforce planner or CHRO is what happened to the specific roles sitting inside their headcount plan, and the answer looks very different depending on which sector you are operating in.
The data below is drawn from JobsPikr’s job posting pipeline across four sectors: tech, healthcare, finance, and logistics. What it shows is not a uniform story of wages going up. It is a more complicated picture where some roles are inflating fast, some are holding steady, and a few are actually contracting, which carries its own set of planning implications.
Tech: A Sector Playing Defence Except Where It Matters Most
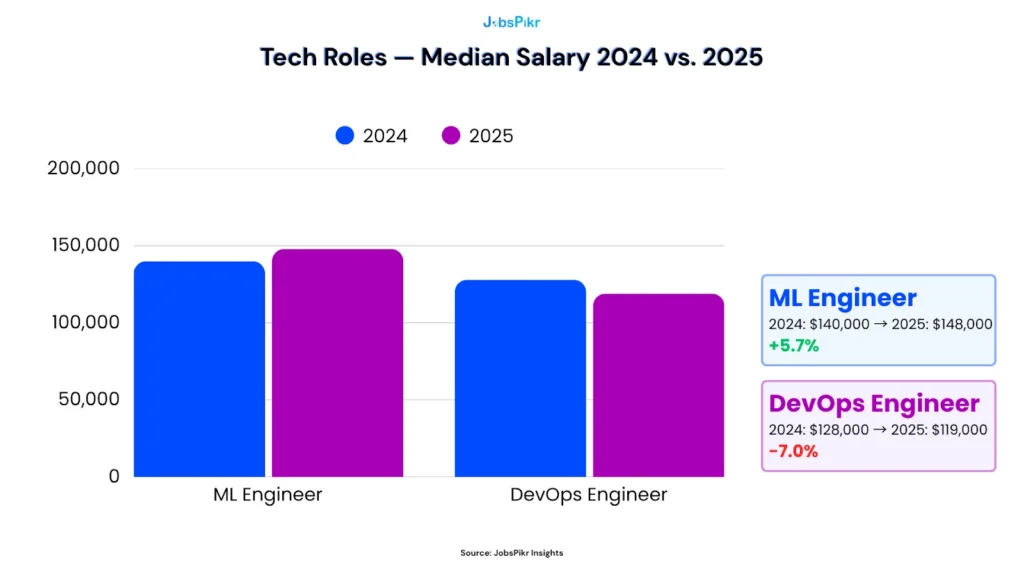
The tech sector in 2025 was not a rising tide lifting all boats. ML Engineers saw meaningful salary growth of 5.7%, moving from $140,000 to $148,000, reflecting sustained demand for machine learning expertise as enterprises pushed AI initiatives from pilot into production. That is a role where supply has genuinely not kept pace with what companies need, and the compensation movement reflects it directly.
DevOps Engineers tell a starkly different story. Median offered salary dropped from $128,000 to $119,000, a 7% contraction that mirrors broader trends in the tech labor market where an oversupply of experienced professionals, combined with slower hiring following years of over-recruitment, has given employers more leverage than they have had in years. For comp teams managing tech roles, this divergence is exactly why a single “tech salary adjustment” applied across the board will overpay in some areas and underpay in others simultaneously.
Healthcare: Persistent Pressure With One Surprise
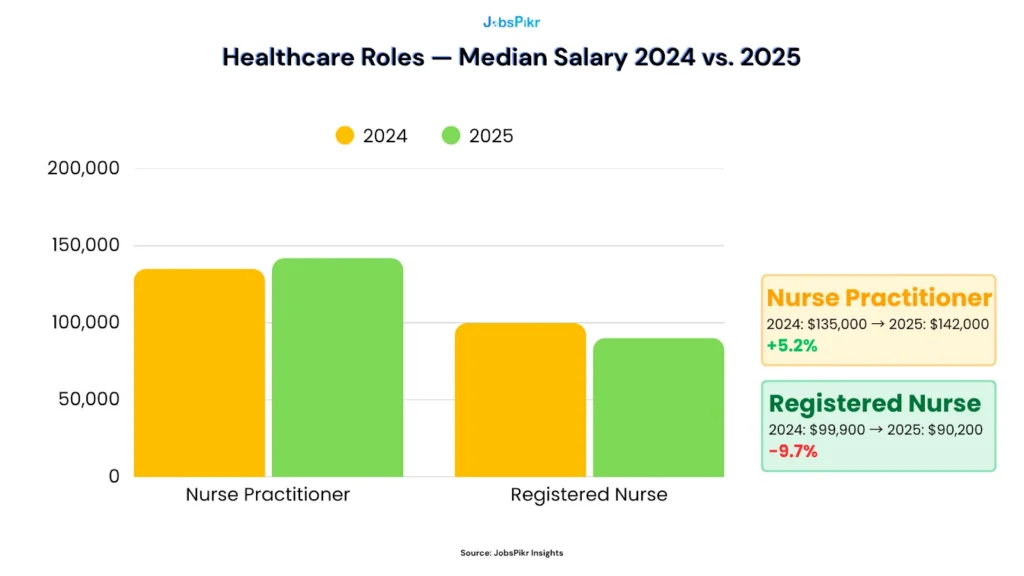
Healthcare is one of the sectors where structural labor shortages have been most widely discussed, which makes the number of Registered Nurses genuinely surprising. Median offered salary for RNs dropped from $99,900 to $90,200, a nearly 10% contraction in advertised compensation. One likely explanation is that the acute post-pandemic nursing premium, where hospitals were offering significant incentives to fill critical staffing gaps, has started to normalize as travel nurse demand cooled and health systems pulled back on premium pay arrangements. That does not mean the underlying shortage has resolved. It means the emergency pricing has partially unwound.
Nurse Practitioners show the opposite pattern, with salary climbing from $135,000 to $142,000, a 5.2% increase driven by growing demand for advanced practice providers in outpatient, primary care, and specialty settings. As BLS projects healthcare and social assistance to drive the largest share of US job gains this decade, the NP salary trajectory is one of the more reliable upward trends in the entire dataset. For healthcare workforce planners, the divergence between RN and NP compensation is a signal worth watching carefully as it has real implications for hiring mix and total staffing cost.
Finance: Quiet Contraction in One Role, Steady Growth in Another
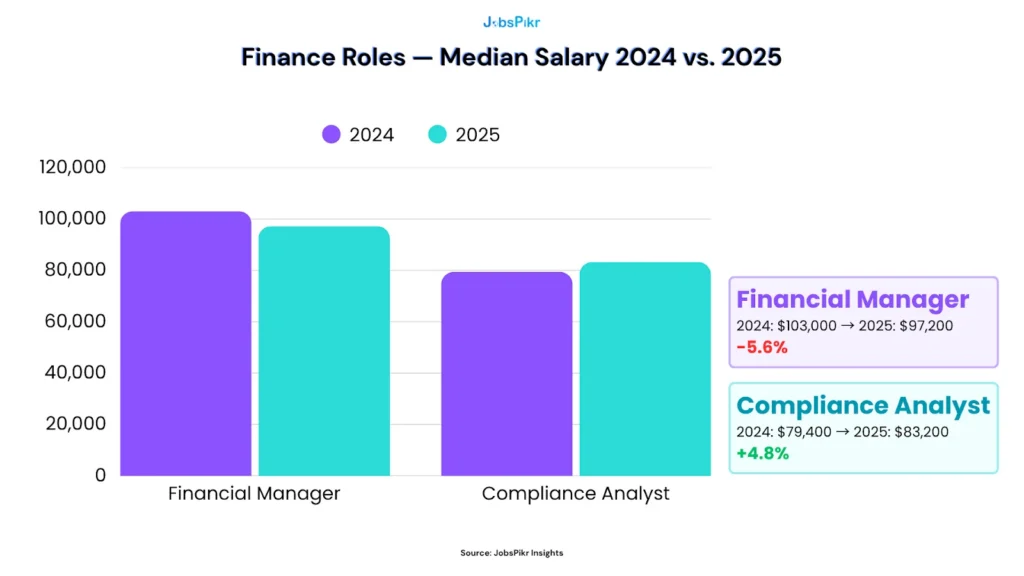
The finance sector data surfaces a pattern that will feel familiar to anyone who has been watching how enterprises responded to economic uncertainty in 2024 and 2025. Financial Manager salaries contracted from $103,000 to $97,200, a 5.6% drop that likely reflects both a broader pullback in senior finance hiring and some compression at the manager level as organizations restructured finance functions around leaner teams with more analytical tooling.
Compliance Analyst compensation moved in the opposite direction, growing from $79,400 to $83,200, a 4.8% increase. Regulatory pressure across financial services, particularly in areas touching AI governance, data privacy, and cross-border reporting requirements, has kept compliance hiring active even as other finance roles softened. This is a role where demand is being driven by external forces that are not going to ease, which makes the upward salary trend more durable than it might appear at first glance.
Logistics: The Sector Quietly Experiencing Real Wage Inflation
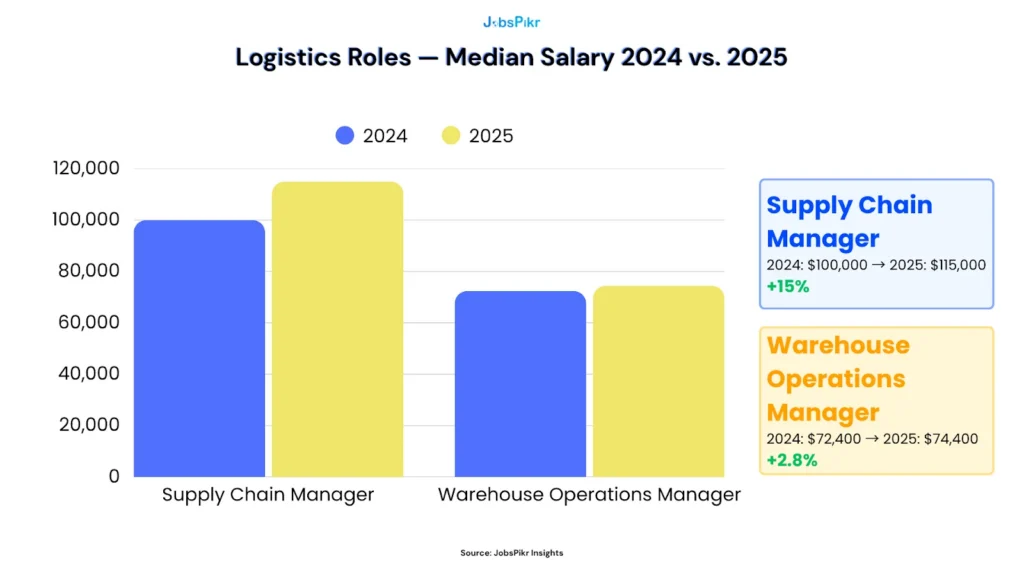
The logistics sector contains the single most significant salary movement in this entire dataset. Supply Chain Manager compensation jumped from $100,000 to $115,000, a 15% increase in a single year that reflects how seriously enterprises are now treating supply chain resilience as a strategic capability rather than a back-office function. Years of disruption have elevated this role in the organizational hierarchy, and the compensation has followed. For any CFO with significant supply chain headcount, this is the number that should be prompting an immediate comp band review.
Warehouse Operations Manager salary growth was more modest at 2.8%, moving from $72,400 to $74,400. That is roughly in line with broader inflation, suggesting the role is holding its value without significant upward pressure, at least in advertised compensation. The contrast between the two logistics roles in this dataset is a good illustration of why seniority and strategic visibility matter as much as sector when you are reading wage inflation signals.
What the Cross-Sector Picture Tells You
Taken together, these four sectors make one thing clear. Wage inflation in 2026 is not a blanket phenomenon that your total rewards team can address with a single annual adjustment percentage. It is a role-by-role reality where the wrong assumption in either direction, overpaying where the market has softened or underpaying where it has surged, carries a direct cost to your P&L and your ability to retain the people who matter most.
“The organizations that will come out ahead on compensation in 2026 are not the ones with the biggest salary budgets. They are the ones with the most current, role-specific data informing every offer and every retention conversation.”
Wage Growth vs. Inflation: What the Numbers Actually Mean for Headcount Planning
There is a version of the wage growth versus inflation conversation that stays purely in macroeconomic territory, comparing CPI figures to average earnings data and drawing broad conclusions about consumer purchasing power. That version is useful for economists. It is not particularly useful for a CFO trying to close out a headcount budget or a CHRO building a total rewards strategy for the next fiscal year.
The more useful framing is this: wage growth and inflation are two separate pressures on your workforce plan, and they need to be tracked separately before you can understand their combined impact.
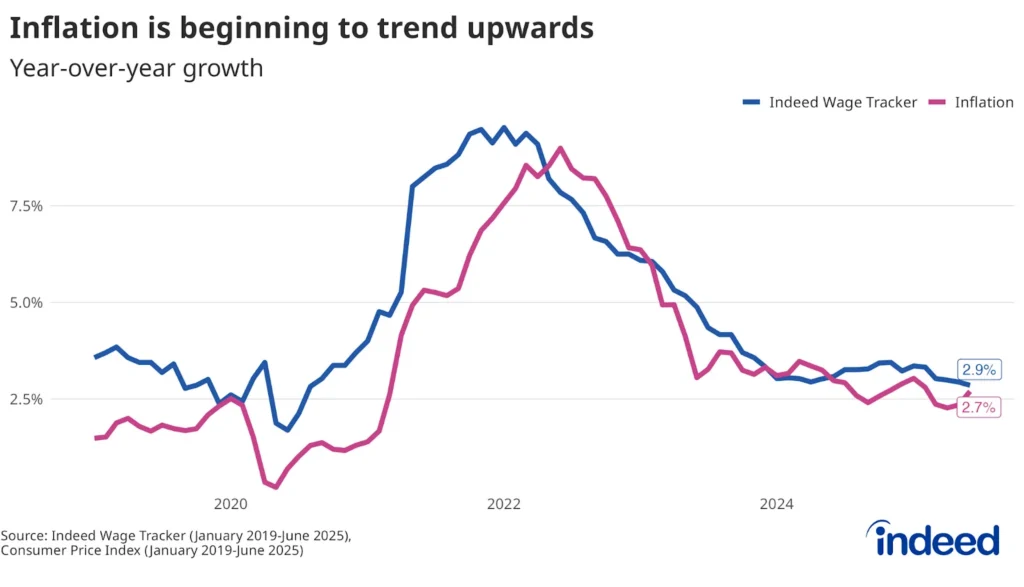
Image Source: Hiringlabs
Wage Growth and Inflation Are Not the Same Pressure
Inflation affects what your employees need to earn to maintain their standard of living. Wage growth in the external market affects what you need to offer to hire and retain them. Those two things often move in the same direction, but they do not move at the same rate, and the gap between them is where most compensation planning goes wrong.
Consider what happened between 2021 and 2024. Inflation surged, peaking at around 9% in mid-2022 in the US, while wage growth initially lagged behind, eroding real purchasing power for workers across most sectors. Then wage growth caught up and in some roles surpassed inflation, creating a different problem for employers: market rates were now running well ahead of internal comp bands that had been built during the inflationary period. The Atlanta Fed Wage Growth Tracker recorded a three-month average annual growth rate of 4.2% as of June 2025, sitting 1.5 percentage points above CPI at the time. But as the data in the previous section shows, that average conceals enormous role-level variation that a single tracker number cannot capture.
What This Means for Your Headcount Budget
The practical problem for workforce planners is that headcount budgets are typically built on assumptions about average salary levels and modest annual increases, neither of which reflects how the market is actually behaving for high-demand roles.
Here is where that breaks down in practice. If your headcount plan assumes a 3.5% average salary increase across all roles, but Supply Chain Managers in your sector are seeing 15% market movement and DevOps Engineers are seeing contraction, your budget is simultaneously too tight in one place and too generous in another. The aggregate number balances out on paper while creating real problems in execution: you cannot fill the supply chain roles at your budgeted rate, and you are overspending on DevOps relative to what the market requires.
The fix is not to build a more complicated spreadsheet. It is to build your headcount budget from role-level market data rather than applying a blanket inflation adjustment to last year’s comp bands. That shift requires access to current, role-specific salary data, which is exactly what most annual survey cycles cannot provide.
The Real Inflation Risk Sitting Inside Your Workforce Plan
Beyond the immediate budgeting problem, there is a slower-moving risk that does not get enough attention in most workforce planning conversations: internal pay compression.
When external wage inflation accelerates for specific roles, organizations that respond only at the point of hire, by raising offers for new joiners to match the market, create a growing gap between what new hires earn and what tenured employees in the same role are making. That gap is invisible in most compensation dashboards until it becomes a retention problem. And by the time it shows up as turnover, the cost has already compounded.
SHRM estimates the cost of replacing a mid-level employee at between 50% and 200% of their annual salary. For a workforce planner, the internal equity audit is not a nice-to-have exercise. It is a direct cost-avoidance measure that pays for itself the first time it prevents a retention conversation from becoming an exit conversation.
Three Questions Every Workforce Planner Should Be Asking Right Now
Most compensation planning conversations focus on averages and budgets. The more useful questions are the ones that cut through the aggregate and get to the role-level reality.
The first question is which roles in your current headcount plan have seen the largest gap open up between your internal comp bands and the current market rate. If you cannot answer that question with data from the last 90 days, your bands are probably already stale for at least a handful of critical roles.
The second question is where your offer acceptance rate has declined over the last two quarters, and whether comp is a likely contributing factor. Candidates rarely cite salary directly when declining an offer, but a pattern of late-stage declines for specific roles is one of the clearest signals that your market positioning has slipped.
The third question is whether your compensation review cycle is fast enough to respond to the market you are operating in. For most high-demand roles in 2026, an annual review cycle is not sufficient. The roles that are experiencing the sharpest wage inflation, AI engineering, supply chain leadership, compliance, advanced practice nursing, are moving faster than a once-a-year process can track.
“The organizations that catch wage inflation early, at the posting velocity stage rather than the turnover stage, are the ones whose headcount plans survive contact with the actual market.”
How Real-Time Compensation Analytics Changes What You Can Actually Do
There is a meaningful difference between knowing that wage inflation is happening and being able to do something about it before it costs you. The first is available to anyone reading a labor market report. The second requires data that is current enough, specific enough, and structured enough to feed directly into real hiring and planning decisions.
This is where the conversation shifts from diagnosis to capability. Real-time compensation analytics does not just give you a better picture of the market. It changes the decisions you can make and the speed at which you can make them.
From Reactive to Proactive: What Changes When Your Data Is Live
The typical compensation analytics workflow is reactive by design. A candidate declines an offer. A valued employee leaves for a higher salary. A recruiter flags that offers are consistently losing in the final rounds. Something breaks, and then the comp team investigates. By the time the investigation is complete and a band adjustment is approved, the organization has already paid the cost of being out of the market.
Live job posting data flips that sequence. When you are tracking salary ranges and posting velocity across your key roles in real time, the signal that a role is heating up arrives before the offer decline does. You see posting volume accelerating for Supply Chain Managers three quarters before your own offers start losing. You see median advertised salaries for ML Engineers climbing past your current band ceiling before your best ML Engineer gets a competing offer. The decision to adjust happens earlier, costs less, and does not require a retention crisis to trigger it.
What JobsPikr’s Data Pipeline Makes Possible
JobsPikr processes over 2.3 million job signals daily across more than 100 countries, structuring raw posting data into normalized, queryable compensation intelligence. That means role titles, salary ranges, location data, required skills, seniority levels, and posting frequency are all extracted, cleaned, and made comparable across sources in real time.
For a comp team, that infrastructure translates into a few specific capabilities that annual surveys simply cannot replicate. You can pull the current median offered salary for a specific role in a specific city, updated within days rather than months. You can see how that number has moved over the last quarter, not just the last year. You can identify which roles in your headcount plan have seen the largest gap open between your internal bands and the live market rate, before that gap starts showing up in your offer acceptance data.
For a CFO or workforce planning lead, the value is upstream of the hiring decision. When your headcount budget assumptions are built from live market data rather than last year’s survey benchmarks, the numbers you take into budget planning conversations are defensible in a way that survey-derived figures often are not. You are not estimating what salaries will be based on what they were. You are working from what they are right now.
Seeing It in Practice
The clearest way to understand what this looks like operationally is to see it running on real data. The demo below walks through JobsPikr’s salary benchmarking workflow, showing how comp teams and workforce planners can pull role-specific, location-specific compensation data and track how it moves over time.
See how JobsPikr’s salary benchmarking works in practice across roles, regions, and time periods
Where Compensation Analytics Fits Into Your Broader Workforce Strategy
Real-time compensation data is most valuable when it is connected to the decisions that sit around it, not treated as a standalone reporting exercise.
For a total rewards strategy, live market data gives HR leaders the ability to audit whether current comp bands are still competitive across every role in the organization, not just the ones that have recently had an open position. That kind of proactive audit catches internal compression before it becomes a turnover problem, which is considerably cheaper than addressing it after the fact.
For headcount planning, the ability to model salary costs using current market rates rather than last year’s actuals means that budget submissions are built on assumptions that will hold through the fiscal year, rather than assumptions that were accurate when the plan was written but have since drifted. For organizations with significant headcount in roles like Supply Chain Manager, Nurse Practitioner, or ML Engineer, that difference in planning accuracy translates directly into budget reliability.
For talent acquisition, knowing the live salary range for a role before you post it means your advertised range is competitive from day one, rather than needing adjustment after the first wave of candidate feedback. That reduces time-to-fill, improves offer acceptance rates, and removes one of the most common sources of friction in the late stages of a hiring process.
“Compensation analytics becomes genuinely strategic when it stops being a reporting function and starts being a planning input. The data needs to be live enough to inform decisions before they are made, not explain outcomes after they happen.”
The Pay Transparency Tailwind Making This More Urgent
One external trend is quietly making real-time compensation analytics more valuable every quarter. Pay transparency legislation is expanding. Multiple US states now require salary ranges in job postings. The EU Pay Transparency Directive is being transposed into national law across member states. Canada and Australia are moving in the same direction.
As more organizations are required to disclose salary ranges in their postings, the quality and coverage of job-posting-derived compensation data improve significantly. More disclosed ranges mean more signal available for benchmarking, which means platforms tracking postings at scale become more accurate and more comprehensive over time. More than 68% of US job postings included salary ranges in 2025, up from 45% in 2023, a trend that is still accelerating. The organizations that build their compensation analytics infrastructure around live posting data now are the ones that will benefit most as that transparency tailwind continues.
Your Wage Inflation Response Starts With Better Compensation Data
The wage inflation story of 2026 is not one story. It is dozens of them, playing out simultaneously across roles, sectors, and geographies, each moving at its own pace and in its own direction. Supply Chain Managers saw 15% salary growth in a single year. DevOps Engineers saw contraction. Nurse Practitioners climbed steadily, while Registered Nurse advertised salaries pulled back. ML Engineers commanded a growing premium while Financial Managers saw compression.
None of that complexity shows up in a headline wage growth figure. And none of it is visible in a compensation survey that was completed six months before you are reading it.
The organizations that will hire and retain the talent they need in 2026 are not necessarily the ones with the largest salary budgets. They are the ones whose compensation decisions are grounded in what the market is doing right now, not what it was doing when someone last ran a survey. They are catching wage inflation at the posting velocity stage, when it is still a planning input, rather than at the offer decline stage, when it has already become a cost. They are running internal equity audits before compression becomes turnover, not after. And they are building headcount budgets on role-level market data that reflects current hiring intent, not annual averages that smooth out the variation that actually matters.
That shift, from periodic compensation reporting to live compensation intelligence, is what separates a reactive total rewards function from a strategic one. It does not require rebuilding your entire HR infrastructure. It requires access to data that moves as fast as the market does, and a planning process that is built to use it.
JobsPikr tracks over 2.3 million job signals daily across more than 100 countries, giving workforce planners, CFOs, and HR strategy leads the role-specific, location-specific compensation intelligence they need to stay ahead of the market rather than perpetually catching up to it. The data in this article, from the posting velocity trends to the sector-by-sector salary movement, comes from that pipeline. It reflects what employers are actively advertising today, which is the most honest signal available of what the market is willing to pay.
Wage inflation will keep moving. The question is whether your compensation analytics are moving with it.
Stop Benchmarking with Data That’s Already a Year Old
JobsPikr processes 2.3M+ job signals daily across 100+ countries. See what the market is offering, right now.
Frequently Asked Questions
1. What is wage inflation and how does it affect compensation planning?
Wage inflation refers to the sustained increase in the cost of labor across the economy or within specific talent markets. For compensation planning, the important distinction is that macro wage inflation, measured by indices like the Employment Cost Index, reflects averages across the entire labor market, while role-level wage inflation can move significantly faster or slower depending on supply and demand dynamics for specific skills. A workforce planner or CFO who builds headcount budgets purely on macro wage growth assumptions risks being materially out of market for high-demand roles before the fiscal year closes. The more useful approach is to track wage inflation at the role level using live market data rather than relying on economy-wide averages that smooth out the variation that actually matters for planning.
2. How is compensation analytics different from a standard salary survey?
A salary survey captures what a sample of participating employers reported paying at a specific point in time, usually six to eighteen months before you are reading the results. Compensation analytics, when built on live job posting data, reflects what employers are actively advertising right now. The difference is not just freshness, it is signal quality. An advertised salary range in a live job posting represents a real budget decision made by someone with a hiring deadline. That is a more direct indicator of market intent than a survey response submitted months ago through a standardized template. For roles experiencing rapid wage inflation, that distinction can mean the difference between a competitive offer and one that loses in the final round.
3. Which industries are seeing the highest wage inflation in 2026?
Based on JobsPikr’s job posting data, logistics and healthcare are showing some of the most significant salary movement heading into 2026. Supply Chain Manager compensation grew 15% from 2024 to 2025, reflecting how seriously enterprises are now treating supply chain resilience as a strategic function. Nurse Practitioner salaries climbed 5.2% over the same period, driven by sustained demand in outpatient and specialty care settings. In tech, the picture is more divided: ML Engineers saw 5.7% salary growth while DevOps Engineers experienced contraction, illustrating why sector-level averages are not sufficient for role-specific planning. Finance shows a similar split, with Compliance Analyst salaries growing 4.8% while Financial Manager compensation declined.
4. What is posting velocity and why does it matter for salary benchmarking?
Posting velocity is the rate at which job postings for a specific role are growing over time. It matters for salary benchmarking because it functions as a leading indicator of compensation pressure. When demand for a role accelerates faster than the available talent supply, employers begin raising offers to compete, but that salary movement typically lags the posting surge by one to two quarters. Tracking posting velocity alongside current salary data gives workforce planners and comp teams an early warning signal that a role is heating up, before that pressure shows up in offer decline rates or retention conversations. AI Engineer postings grew from 6,110 in 2023 to 81,500 in 2025 according to JobsPikr data, a signal that was visible well before the salary curve fully reflected the demand surge.
5. How often should companies update their compensation benchmarks?
For most professional roles, an annual compensation review cycle was sufficient when labor markets moved predictably. In the current environment, that cadence is no longer adequate for high-demand roles. Roles experiencing active posting volume growth or operating in sectors with structural talent shortages, such as AI engineering, advanced practice healthcare, compliance, and supply chain leadership, should be benchmarked at minimum on a quarterly basis using live market data. For roles where posting velocity is accelerating sharply, a monthly check against current advertised salary ranges is a reasonable precaution. The goal is to catch market movement before it shows up in your offer acceptance data, not after. Organizations that treat compensation benchmarking as a live, ongoing function rather than an annual reporting exercise consistently outperform on both hiring and retention metrics for critical roles.