- **TL;DR**
- What Is the Labor Force Participation Rate (LFPR)?
- The Basics: What LFPR Actually Measures
- Want a tailored LFPR briefing for your team?
- The Historical View: Peaks and Valleys
- The Big Drivers: What Moves LFPR
- LFPR, Skills Mismatch, and the “Invisible” Labor Pool
- The COVID Earthquake
- How America Compares Globally
- Beyond the Headline: Alternative Measures
- LFPR as a Leading Indicator of Labor Market Change
- Regional and Industry Patterns
- Looking Ahead: What's Next for LFPR
- Why LFPR Should Be Read With Real-Time Job Market Data
- Why This Matters for Business and Analysis
- What LFPR Tells Us About the Future of Work (2025 and Beyond)
- Want a tailored LFPR briefing for your team?
- FAQs
**TL;DR**
The Labor Force Participation Rate (LFPR) measures the share of working-age Americans either employed or actively seeking work. In July 2025, LFPR fell to 62.2%, near its long-term average but below pre-COVID levels. Unlike the unemployment rate, LFPR also captures those who’ve stopped looking for work—often due to schooling, retirement, or discouragement. Key drivers include demographics (aging baby boomers), education trends, social programs, and technology shifts. While the U.S. lags many developed nations in LFPR, supportive policies, flexible work, and immigration could help boost participation and expand the labor force in the years ahead.
What Is the Labor Force Participation Rate (LFPR)?
The Labor Force Participation Rate (LFPR) measures how much of the working-age population is actually engaged in the labor market.
In simple terms, it answers one core question:
How many people are working — or actively trying to work — compared to everyone who could be working?
LFPR is expressed as a percentage and focuses on participation, not employment success. That distinction is critical and often misunderstood.
The Official Definition (Without the Jargon)
LFPR is calculated as:
Labor Force Participation Rate =
(Labor Force ÷ Civilian Non-Institutional Population) × 100
Here’s what that really means.
The labor force includes:
- People who currently have a job
- People who do not have a job but are actively looking for one
The civilian non-institutional population includes:
- Everyone aged 16 and older
- Excluding people in prisons, long-term care facilities, or the military
Anyone who is not working and not actively looking for work is counted as outside the labor force.
That includes:
- Retirees
- Full-time students not job searching
- Stay-at-home caregivers
- People with long-term illnesses or disabilities
- Discouraged workers who’ve stopped looking
So when the U.S. LFPR is 62.2%, it means:
Out of every 100 working-age Americans, 62 are participating in the labor market, and 38 are not.
What LFPR Is Not
LFPR is often confused with other labor metrics, but it serves a different purpose.
It is not:
- The unemployment rate
- A measure of job creation
- A direct indicator of economic strength
- A count of people who want to work
The unemployment rate only looks at people who are already in the labor force. LFPR looks at who shows up to the labor market at all.
This is why LFPR can fall even when unemployment is low — and why it plays such an important role in trend analysis.
The U.S. labor market just delivered a surprise. July 2025 saw only 73,000 jobs added—well below the expected 115,000. But buried in those headlines was another story: the Labor Force Participation Rate (LFPR) ticked down to 62.2%. For analysts, students, and anyone trying to decode labor market signals, LFPR often gets overshadowed by the unemployment rate. Yet it tells a fundamentally different story about who’s working, who’s looking, and who’s stepped away entirely. Let’s break down what this critical metric actually measures and why it moves the way it does.
The Basics: What LFPR Actually Measures
The Labor Force Participation Rate sounds complex, but the math is straightforward:
LFPR = (Labor Force ÷ Civilian Non-Institutional Population) × 100
The labor force includes:
- People currently employed
- People actively looking for work (unemployed)
It doesn’t include:
- Students not working or job searching
- Retirees
- People unable to work due to disability
- Those who’ve stopped looking (discouraged workers)
- Anyone under 16
Think of it as the share of working-age Americans who are either working or actively trying to work. The current 62.2% means roughly 62 out of every 100 working-age Americans are either employed or job hunting. The remaining 38% have stepped back from the workforce entirely.
Where We Stand Today
The latest numbers paint a picture of gradual decline:
- July 2025: 62.2%
- June 2025: 62.3%
- May 2025: 62.4%
That year-over-year drop of 0.5 percentage points might seem small. But when you’re talking about millions of people, small shifts matter. The employment-population ratio sits at 59.6%, meaning about 60% of working-age Americans actually have jobs. The gap between LFPR (62.2%) and employment ratio (59.6%) represents those actively job searching. With unemployment at 4.2%, we’re seeing a labor market where most people who want work can find it. The bigger question is why fewer people want to participate at all.
Want a tailored LFPR briefing for your team?
Request a demo and we’ll prepare a short report showing LFPR, employment-population gaps, and job-posting trends for your target markets.
The Historical View: Peaks and Valleys
To understand where we are, you need context on where we’ve been.
The Peak Years
The all-time high came in July 1997: 68.1%. That was the economy firing on all cylinders. Tech was booming, unemployment was low, and nearly 7 out of 10 working-age Americans were in the workforce.

The Great Decline
Since that 1997 peak, LFPR has dropped 5.8 percentage points. That’s not a gradual slide, it’s been driven by specific events:
- Pre-Great Recession (2007): 66.0%
- Great Recession low (2015): 62.4%
- Pre-COVID (February 2020): 63.4%
- COVID low (April 2020): 60.1%
Each crisis knocked people out of the workforce. Some came back. Many didn’t.
The Long View
Since 1948, LFPR has averaged 62.9%. We’re sitting right at that historical average, but the composition has changed dramatically. The 1950s saw low participation as most women stayed home. The 1970s-90s boom came as women entered the workforce en masse. Now we’re seeing the reverse: baby boomers retiring in record numbers.
Demographics: Who Participates and Who Doesn’t
LFPR isn’t uniform across America. The breakdowns reveal striking patterns.
By Age: The Prime-Age Story
Prime-age workers (25-54) remain the backbone:
- Overall prime-age LFPR: 83.4%
- Men aged 25-54: 89.2%
- Women aged 25-54: 77.7%
These are people in their career-building years, with mortgages, kids, and peak earning potential. Their participation rate stays relatively stable even when overall LFPR drops.
But look at the extremes:
- Ages 16-19: 36.9%
- Ages 65+: 19.2%
Young people increasingly stay in school longer. Older Americans can afford to retire earlier thanks to decades of wealth building.
By Gender: The Persistent Gap
Men still participate at higher rates:
- Male LFPR: 68.0%
- Female LFPR: 56.8%
- Gender gap: 11.2 percentage points
But this gap has narrowed dramatically. In the 1950s, it was over 40 percentage points. Women’s workforce entry drove much of the LFPR surge from the 1960s-1990s. Interestingly, prime-age women nearly hit their record high of 78.4% in August 2024. The recent decline reflects broader demographic shifts, not women leaving the workforce.
By Race and Ethnicity: Complex Patterns
The data reveals persistent disparities:
Men by race:
- Asian men: 76.8%
- Hispanic men: 75.1%
- White men: 68.2%
- Black men: 65.6%
Women by race:
- Black women: 61.0%
- Hispanic women: 58.7%
- Asian women: 58.1%
- White women: 56.5%
These gaps reflect historical factors, educational differences, regional economics, and ongoing structural barriers.
By Education: The Great Divide
Education creates the starkest participation gaps:
Men:
- Bachelor’s degree+: 76.9%
- Less than high school: 59.4%
- Gap: 17.5 percentage points
Women:
- Bachelor’s degree+: 69.6%
- Less than high school: 34.3%
- Gap: 35.3 percentage points
For women without high school diplomas, workforce participation is extraordinarily low. The combination of limited job opportunities and childcare costs often makes working financially unviable.
The Big Drivers: What Moves LFPR
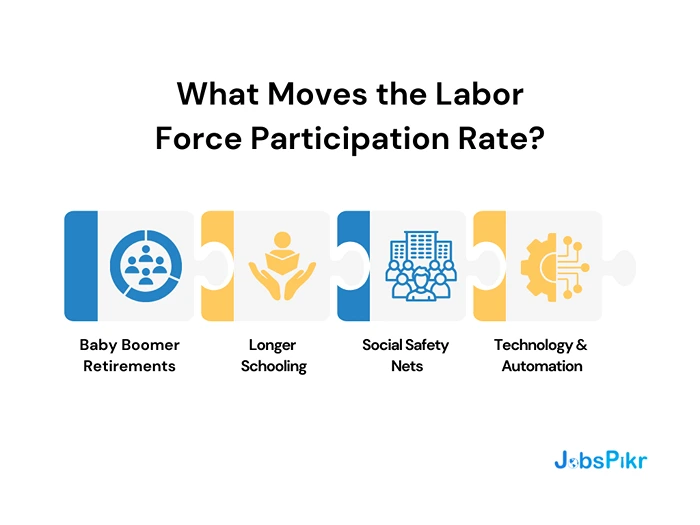
1. Demographics: The Baby Boomer Tsunami
This is the biggest story in American labor markets.
The numbers are staggering:
- 10,000 baby boomers turn 65 every day
- 30.4 million boomers will retire between 2024-2030
- All boomers reach retirement age by 2030
Currently, 17.9% of Americans are 65+. By 2030, that jumps to 21.6%. This demographic shift alone will knock LFPR down by an estimated 2.5 percentage points by 2030. It’s not economic weakness—it’s math.
2. Educational Trends
More young people stay in school longer, reducing their workforce participation. This impacts LFPR by -0.8 percentage points. Graduate school enrollment has surged. Professional programs require longer training periods. Many students work part-time but aren’t actively job searching.
3. Social Programs and Safety Nets
Expanded benefits reduce the pressure to work. This impacts LFPR by -0.3 percentage points. This includes everything from Social Security Disability to expand Medicaid to student loan forbearance programs.
4. Technology and Automation
Job displacement drives some workers out permanently. This impacts LFPR by -0.4 percentage points. When factories close or entire industries get automated, older workers often find it easier to take early retirement than retrain for new careers.
LFPR, Skills Mismatch, and the “Invisible” Labor Pool
One of the most misunderstood aspects of LFPR is the assumption that people outside the labor force are “unavailable.” In reality, a significant share are conditionally available — but blocked by skills mismatch rather than lack of willingness.
This is where LFPR intersects directly with skills intelligence.
Many workers who exited the labor force after 2020 didn’t leave because they didn’t want to work. They left because:
- Their skills no longer aligned with available roles
- Entry-level jobs demanded credentials they didn’t have
- Mid-career workers faced automation without clear retraining paths
Traditional labor statistics don’t show this friction. LFPR does — indirectly. When participation drops while job postings remain high in certain industries, it signals a skills bottleneck, not a labor shortage.
Healthcare, logistics, and data roles illustrate this clearly. Demand has surged, yet participation among adjacent worker groups hasn’t risen at the same pace. The result is an “invisible labor pool”: people who could work if reskilled, but aren’t counted as unemployed because they aren’t actively searching.
This is why modern market trend analysis must go beyond counts. It requires:
- Mapping LFPR changes by age and education
- Overlaying job posting skill requirements
- Identifying where retraining could realistically pull people back into the workforce
For employers, this reframes workforce strategy. The question shifts from “Why can’t we hire?” to “Who is sitting just outside the labor force — and what would bring them back?”
The COVID Earthquake
The pandemic created the largest workforce disruption since the Great Depression.
The Immediate Impact
In April 2020, LFPR cratered to 60.1%, a drop of 3.3 percentage points in just two months. The labor force lost 8.4 million people virtually overnight.
Women bore the brunt:
- Women’s employment drop: -33 percentage points
- Men’s employment drop: -15.8 percentage points
School closures, childcare facility shutdowns, and elder care needs forced millions of women out of the workforce.
The Incomplete Recovery
We’ve recovered 2.1 percentage points since that April 2020 low. But we’re still 1.2 percentage points below pre-COVID levels.
Some of this reflects ongoing demographic trends. But 16 months after the initial shock, we’re still seeing lingering effects from people who left the workforce and haven’t returned.
Youth Impact
Interestingly, the pandemic hit young men’s workforce participation harder than young women’s. Many delayed entering the job market, stayed in school longer, or moved back home.
How America Compares Globally
The U.S. lags most developed economies in workforce participation.
International LFPR (2024):
- OECD average: 74.0%
- U.S.: 62.3% (11.7 percentage points below)
Countries above the U.S.:
- Qatar: 89.0%
- Iceland: 82.5%
- Switzerland: 81.2%
- Sweden: 81.0%
- Germany: 78.2%
- Japan: 77.8%
- France: 71.5%
- Italy: 67.2%
Part of this reflects measurement differences. But it also shows room for improvement through better policies around childcare, elder care, skills training, and flexible work arrangements.
Beyond the Headline: Alternative Measures
The standard unemployment rate (U3) only tells part of the story. The Bureau of Labor Statistics tracks six different measures (U1 through U6):
- U3 (official unemployment): 4.0%
- U6 (broadest measure): 7.8%
That 3.8 percentage point gap captures:
- 369,000 discouraged workers who’ve stopped looking
- Marginally attached workers who want jobs but aren’t actively searching
- 4.7 million people working part-time but wanting full-time work
Add in the 6.2 million Americans who want jobs but aren’t in the labor force, and the picture gets more complex.
LFPR as a Leading Indicator of Labor Market Change
Most labor market metrics tell you what already happened. LFPR is different. When used correctly, it works as a leading indicator of workforce stress, long before unemployment rises or job growth slows.
Here’s why this matters.
When businesses face uncertainty, they usually stop hiring before they start firing. Job postings decline. Hiring slows. But unemployment doesn’t move immediately because people are still employed. LFPR, however, often starts shifting earlier. Workers who sense fewer opportunities may delay entering the workforce, return to school, retire earlier than planned, or simply stop looking.
This makes LFPR one of the earliest signals of:
- Shrinking future talent supply
- Regional labor market cooling
- Long-term wage pressure
For example, in several U.S. metros in late 2024, job postings flattened while unemployment remained low. LFPR among prime-age workers dipped slightly in those same regions. Six months later, hiring slowed meaningfully. The signal was there early — but only visible through trend analysis, not headline numbers.
For workforce planners and analysts, this changes how LFPR should be used. It’s not just a descriptive statistic. It’s a diagnostic tool. When participation falls among specific age groups or skill clusters, it often predicts hiring bottlenecks before they become operational problems.
In 2025, organizations that rely only on unemployment rates are reacting late. Those tracking LFPR alongside job posting and skills data are planning ahead.
Regional and Industry Patterns
LFPR varies dramatically across geography and industry.
Regional Leaders and Laggards
- Highest: North Dakota, Vermont, New Hampshire
- Lowest: West Virginia
Energy-rich states with good-paying jobs tend to have higher participation. States with declining industries or limited opportunities see more people exit the workforce.
Industry Concentration Effects
Local economic specialization drives regional LFPR patterns:
- Healthcare regions: Growing participation due to aging population needs
- Technology hubs: High participation for skilled workers, barriers for others
- Manufacturing areas: Declining participation due to automation
- Rural agricultural areas: Often higher participation but seasonal variation
Looking Ahead: What’s Next for LFPR
Multiple scenarios are possible, but demographics will dominate:
The Pessimistic Case
Brookings projects LFPR could fall to 58.0% by 2030—a 4.3 percentage point drop from today.
This assumes:
- Continued baby boomer retirements
- No major policy interventions
- Ongoing technology displacement
- Limited immigration reform
The Optimistic Case
LFPR could stabilize or even rise 2-3 percentage points if we see:
Policy Changes:
- Comprehensive childcare support
- Immigration reform bringing in working-age population
- Skills training programs for displaced workers
- Criminal justice reform removing employment barriers
Workplace Evolution:
- Flexible work arrangements keeping older workers engaged longer
- Remote work expanding opportunities in lower-participation regions
- Gig economy providing more accessible entry points
The Wild Cards
Several factors could dramatically shift projections:
- Automation: 22% of jobs face transformation by 2030. How workers adapt will determine whether technology displaces people permanently or creates new opportunities.
- Immigration Policy: Significant potential impact, as working-age immigrants typically have high participation rates.
- Economic Crisis: Recessions typically lower LFPR initially, but recovery patterns vary widely.
Why LFPR Should Be Read With Real-Time Job Market Data
LFPR data is released monthly and revised over time. By itself, it is accurate — but slow.
This is where real-time labor market data fundamentally changes how LFPR should be interpreted in 2025.
Job postings, skill demand, and hiring intent data update daily. When these signals are layered with LFPR, analysts can distinguish between:
- Temporary exits vs structural disengagement
- Regional slowdowns vs national trends
- Skill shortages vs participation shortages
For example:
- Falling LFPR + rising job postings = skills mismatch
- Falling LFPR + falling job postings = demand slowdown
- Stable LFPR + rising postings = future wage pressure
This combined approach transforms LFPR from a backward-looking statistic into a forward-looking planning signal.
For JobsPikr’s audience, this is where value is created. The real insight isn’t the number itself — it’s how LFPR behaves alongside hiring activity, role evolution, and skill demand. That is what turns labor data into actionable intelligence.
Why This Matters for Business and Analysis
LFPR provides insights you can’t get from unemployment rates alone.
Talent Supply Signals
When LFPR drops in specific regions or demographics, it signals shrinking talent pools. Companies planning expansion need to factor this into location and recruitment strategies.
Economic Capacity
Lower LFPR means the economy has less room to grow without triggering wage inflation. It’s a key input for Federal Reserve policy decisions.
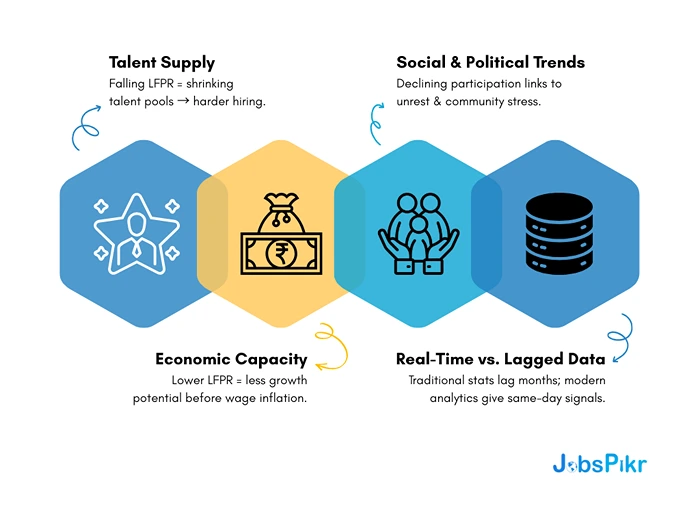
Social and Political Trends
Declining participation often correlates with social unrest, political polarization, and community health problems. It’s a leading indicator of broader societal stress.
Real-Time vs. Lagged Data
Traditional LFPR data comes with a 1-2 month lag. Modern workforce analytics can provide same-day insights into labor market dynamics through job posting patterns, application flows, and skills demand signals. The combination of real-time job market data with traditional economic indicators creates a more complete picture of where labor markets are heading.
What LFPR Tells Us About the Future of Work (2025 and Beyond)
Labor Force Participation Rate tells the story of American work in a way that unemployment statistics miss entirely. At 62.2%, we’re at historical averages but facing unprecedented demographic pressures. The baby boomer retirement wave will continue pulling LFPR down for the next decade. But within that broad trend, opportunities exist. Companies that understand regional variations, demographic patterns, and emerging skills gaps will find talent others miss. For analysts tracking labor market health, LFPR provides early warning signals about economic capacity, wage pressure, and social stability that complement traditional metrics.
The key is remembering what the number actually measures: not just economic health, but the fundamental question of how many Americans choose to participate in work at all. That choice is shaped by demographics, economics, policy, and technology in ways that make LFPR both predictable in broad trends and surprising in specific moments. Understanding those forces helps decode not just where we’ve been, but where American work is heading next.
Want a tailored LFPR briefing for your team?
Request a demo and we’ll prepare a short report showing LFPR, employment-population gaps, and job-posting trends for your target markets.
FAQs
1. What is the labour participation rate?
The labour participation rate shows the percentage of working-age people who are either employed or actively looking for work. It tells us how many people are engaged in the job market compared to the total population.
2. What is the current labor force participation rate?
As of July 2025, the U.S. labor force participation rate is 62.2%, meaning about 62 out of every 100 working-age Americans are working or seeking work.
3. How do you calculate the labor participation rate?
The formula is simple:
Labor Force Participation Rate = (Labor Force ÷ Civilian Non-Institutional Population) × 100
The labor force includes people with jobs and those actively looking for work.
4. Why is the labor force participation rate so low?
The main reasons include aging baby boomers retiring, more young people staying in school longer, and some workers leaving due to health issues, childcare needs, or discouragement after job loss.
5. How to increase labor force participation rate?
Governments and businesses can raise participation by offering affordable childcare, flexible work options, better training programs, immigration reforms, and policies that support older workers to stay employed longer.