- **TL;DR**
- The Hidden Signal That Reveals Everything
- What the AI Readiness Index Measures, and Why It's Different
- See how your region ranks in the global AI race
- When Global Leadership Shifts Overnight
- Why Traditional "Readiness" Metrics Miss Everything That Matters
- The Four Dimensions That Actually Predict Success
- The Compensation Reality: Where Talent Commands Premium
- Corporate Intelligence: How the Giants Actually Hire
- The Real-Time Advantage: Why Monthly Data Changes Everything
- The Next Wave of AI Hiring
- Strategic Response Framework: From Intelligence to Action
- The Opportunity Window
- Ready to See Where Your City Stands?
- See how your region ranks in the global AI race
- FAQs
**TL;DR**
- AI is no longer experimental. It’s driving measurable GDP growth and reshaping industries from finance to healthcare.
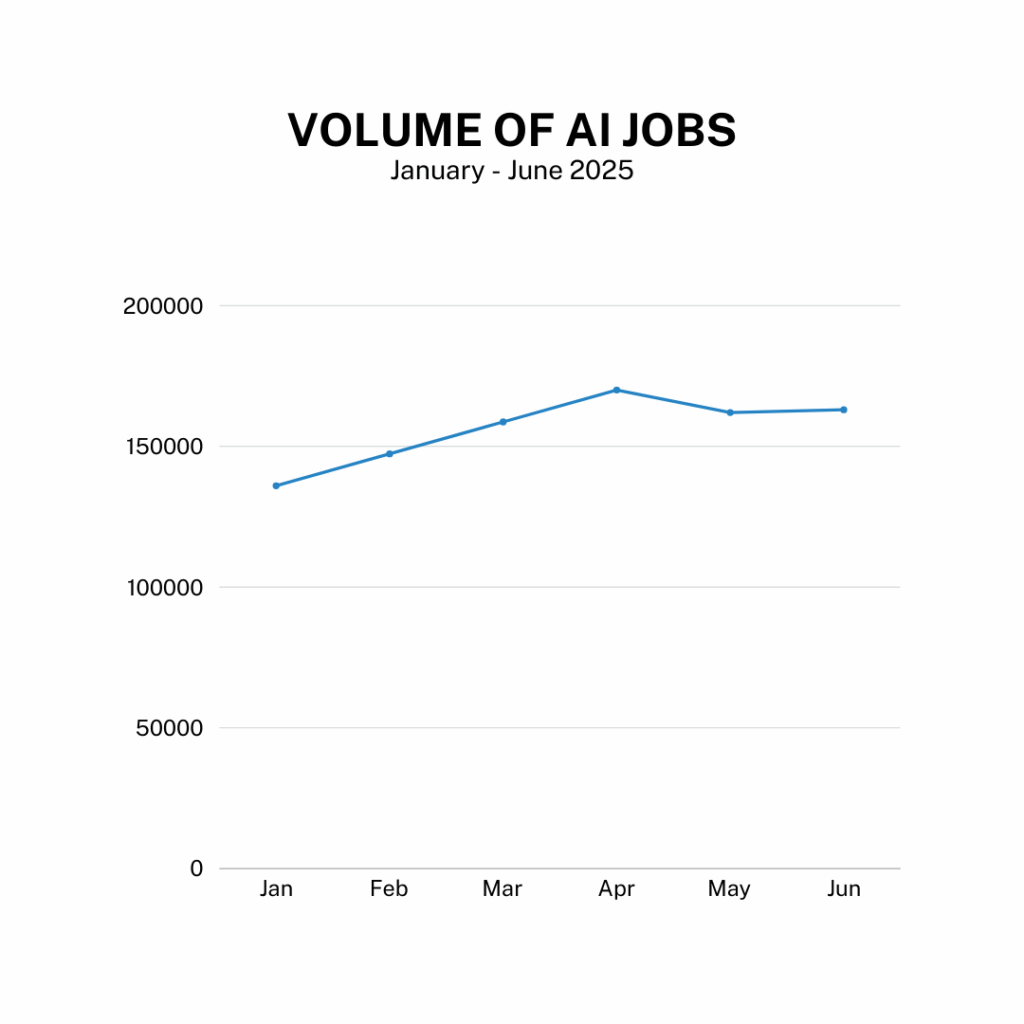
- 953,000 AI job postings in H1 2025 reveal the most reliable signal of where AI adoption is accelerating and which regions are leading.
- Traditional readiness metrics fall short because they lag behind real-time hiring data, aggregate at the national level, and focus on supply-side capacity rather than demand.
- The AI Readiness Index provides a new framework built on four dimensions: volume, geographic concentration, skill penetration, and industry adoption.
- Top skills in demand include machine learning, Python, cloud computing, communication, and business acumen, often in combination.
- Salaries are climbing, with AI workers commanding a 32% premium over non-AI roles, while shortages create hiring delays averaging 77 days.
- The next wave of AI hiring is moving toward specialized roles (MLOps, GenAI ops, ethics officers), requiring proactive talent strategies.
- Stakeholders ranging from governments to universities must act on real-time signals to avoid being left behind.
- The AI race is on: those relying on outdated reports will react too late.
Artificial intelligence has evolved from experimental technology into the backbone of productivity transformation across finance, healthcare, manufacturing, and beyond. According to the IMF, AI will boost global GDP by approximately 0.5% annually between 2025 and 2030, while PwC research reveals AI could contribute £630 billion to the UK economy by 2035.
The choices cities, institutions, and companies make today in attracting and developing AI talent will define their economic resilience and competitive positioning for the next decade. Yet this growth won’t be evenly distributed. The regions that understand and act on real-time AI readiness signals will compound their advantages, while those waiting for next year’s reports will find themselves reacting to last year’s market conditions.
Understanding where AI is taking root isn’t just curiosity, it’s essential strategic intelligence for navigating an economy where 4.2 million AI positions remain unfilled globally while only 320,000 qualified developers are available.
The Hidden Signal That Reveals Everything
If you want to see where AI is truly taking root, don’t look at press releases or venture funding announcements. Look at job postings. In the first half of 2025, employers created more than 953,000 AI-tagged postings across 106+ platforms worldwide. Each posting represents a hiring manager with a budget, a deadline, and specific skill requirements, actively rebuilding their organization around artificial intelligence capabilities.
These signals tell a sharper story about regional AI readiness than broad surveys or static rankings ever could. They reveal a simple truth: AI’s economic trajectory is intensely local, shaped by thousands of employer decisions in specific cities, industries, and teams. With AI adoption accelerating at unprecedented rates [90% of companies now piloting or investing in AI compared to 59% in 2023], the ability to decode these workforce signals becomes critical for strategic positioning.
What the AI Readiness Index Measures, and Why It’s Different
The AI Readiness Index represents a forward-looking framework based on real-time analysis of over 953,000 AI-related job postings collected across 106+ platforms globally in the first half of 2025. Unlike traditional AI readiness assessment models relying on slowly updated surveys, it captures actual employer demand where jobs are posted, the skills required, the industries adopting AI, and compensation offered. This real-time signal reveals not only who’s winning the AI readiness race but why.
The Index measures four interconnected dimensions: job volume, geographic distribution, industry-specific demand, and skill penetration. While academic assessments debate theoretical frameworks, employers make concrete decisions about where to locate teams, which skills to prioritize, and what compensation to offer. This demand-side reality empowers decision-makers with precise, actionable intelligence rather than backward-looking reports.
See how your region ranks in the global AI race
Schedule a demo and we’ll show you real-time AI hiring data, salary benchmarks, and skill demand patterns to help you make data-driven workforce and economic development decisions.
When Global Leadership Shifts Overnight
The most striking revelation from the data challenges every assumption about AI’s geographic center of gravity. Bangalore now leads the world with 32,100 AI job postings, decisively outpacing traditional powerhouses like San Francisco and New York. This isn’t just cost arbitrage. It represents a fundamental rebalancing of where AI innovation actually happens.

When the world’s largest AI hiring market shifts from Silicon Valley to an emerging hub, it signals that the next generation of breakthroughs may emerge from unexpected places. Bangalore isn’t alone; Hyderabad and Pune are rapidly climbing the charts, while secondary US markets like Austin and Boston are proving that momentum is no longer concentrated only in coastal giants. European hubs such as London and Berlin are carving out their own strengths in fintech and enterprise AI adoption.
The monthly volatility patterns reveal even more dramatic shifts. While overall trends show sustained growth, individual cities experience wild swings, some growing 28% month-over-month while others decline 27% in the same period. This volatility reflects rapid capital reallocation as companies optimize their global AI talent strategies in real time, with research showing that AI-related capital expenditures have contributed more to GDP growth than consumer spending in 2025.
Key Takeaways:
- Geographic AI readiness is shifting rapidly and unpredictably
- Monthly volatility patterns reveal real-time capital allocation decisions
- Proximity to a historic tech hub no longer guarantees advantage
Why Traditional “Readiness” Metrics Miss Everything That Matters
Academic indices and government surveys paint broad pictures but miss the granular intelligence that drives actual economic outcomes. While researchers debate theoretical frameworks, employers make concrete decisions about where to locate teams, which skills to prioritize, and what to pay.
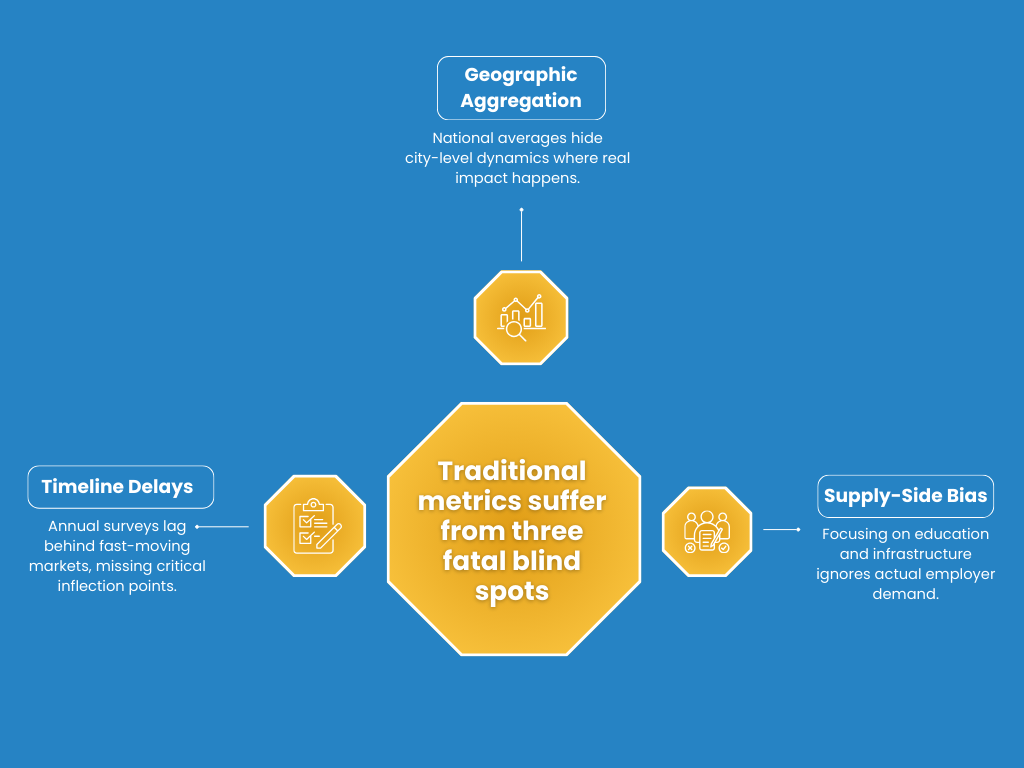
Traditional metrics suffer from three fatal blind spots:
- Timeline Delays: Most assessments rely on annual surveys that lag market reality by months or years. In a market where monthly posting volumes vary from 136,000 to 170,000, these delays mean missing critical inflection points entirely. Research shows that AI skills have become the main shortage area, jumping from 28% to 55% of companies reporting undersupply in just 16 months, the fastest increase recorded in 15 years.
- Geographic Aggregation: National-level metrics obscure local dynamics where actual impact occurs. Knowing “the United States” has strong AI readiness means nothing to a mayor trying to understand whether their city is gaining or losing ground in a market where 65% of qualified AI developers are concentrated in only 5 metropolitan areas.
- Supply-Side Bias: Most indices focus on educational capacity or infrastructure investment, the supply factors that may not align with actual employer demand. Job postings represent demand-side reality: what companies need, when they need it, and what they’ll pay. With universities producing 40% fewer AI-ready graduates than market demand, supply-side metrics fundamentally miss the mark.
The Four Dimensions That Actually Predict Success
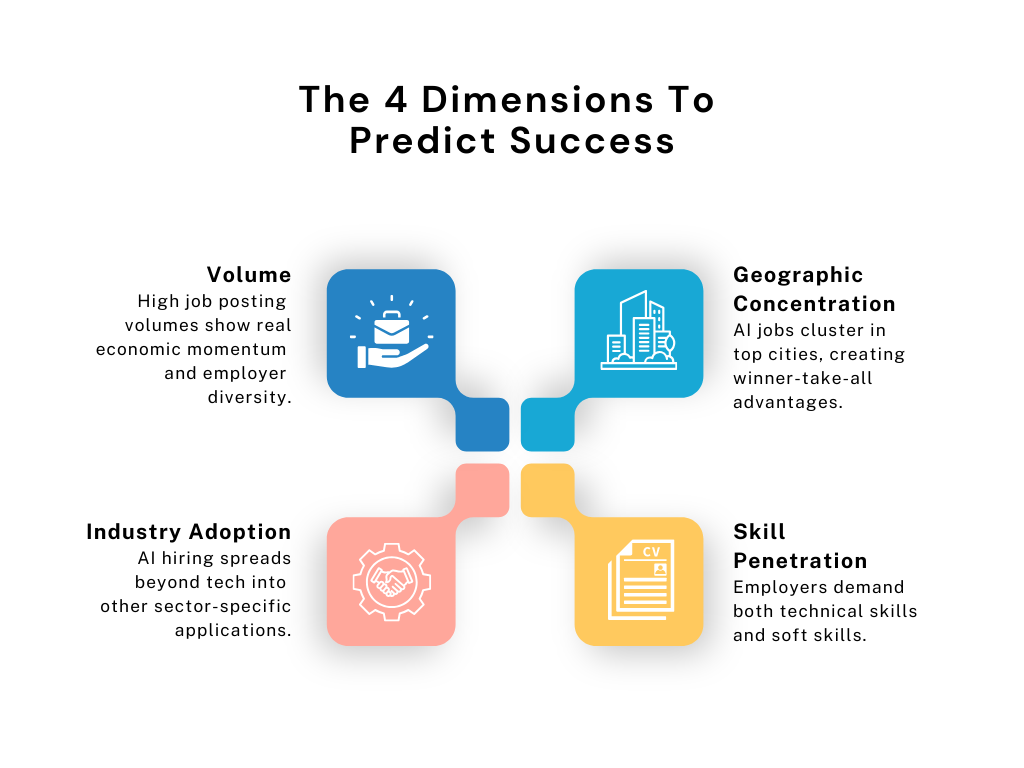
Real AI readiness requires understanding four interconnected dimensions that job posting data reveals with unprecedented clarity:
1. Volume: The Scale Signal
Raw posting volume serves as the most direct indicator of economic momentum. Cities generating thousands of AI job postings attract investment and talent that creates self-reinforcing growth cycles. The data reveals clear market tiers, with top performers ranging from 8,000 to 32,000+ postings in the first half of 2025. What makes volume particularly telling is its consistency across platforms, high-volume cities typically show presence across 15-33 different job platforms, indicating robust employer diversity. This platform diversity directly correlates with market sophistication and hiring commitment, as companies maintaining multi-platform presence demonstrate systematic talent acquisition processes.
2. Geographic Concentration: The Winner-Take-All Reality
AI hiring patterns reveal stark geographic concentration with profound implications for regional economic development. While the top global hubs include Bangalore, New York, San Francisco, Seattle, and London, the full competitive landscape shows surprising emerging markets and declining traditional centers. The top 10 cities capture disproportionate opportunities while hundreds of smaller markets compete for remaining positions. This concentration reflects compound advantages: high posting volume attracts more companies, which generates more opportunities, which creates deeper talent pools, which attracts additional investment. Cities like Singapore and Amsterdam are successfully leveraging digital twin technology and AI-powered urban planning to create competitive advantages, while regional hubs are building sector-specific capabilities rather than competing only in generalized tech markets.
3. Skill Penetration: Beyond the Buzzwords
The most actionable insights emerge from analyzing specific skill requirements across hundreds of thousands of postings. Here’s what drives hiring decisions:
Core Technical Skills:
- Machine Learning dominates with 623,000 mentions, accounting for nearly 65% of AI-related roles. For example, Bangalore alone features over 15,000 postings requiring advanced machine learning expertise, reflecting its deep focus on AI innovation.
- Python programming appears in 430,000 positions, a testament to its role as the lingua franca of AI development; even emerging hubs like Austin and Toronto are rapidly expanding their Python-driven talent pools.
- Cloud Computing shows up in 299,000 postings, indicating how AI workflows increasingly depend on scalable, cloud-based infrastructure.
The Soft Skills Surprise: Communication skills appear in 348,000 postings, nearly matching technical requirements, while business acumen shows up in 343,000 positions. This blend reflects employers’ demand for technical talent who can bridge complex AI concepts with strategic business value. For instance, financial services hubs like New York show a higher proportion of postings listing business skills alongside technical qualifications, while AWS certification alone appears in 9,520 postings across 52 platforms with premium compensation ranges. The complete analysis reveals three distinct skill tiers, with specific combinations that maximize employability and detailed certification pathways that command market premiums.
4. Industry Adoption: AI’s Reach Beyond Tech
AI’s footprint now extends well beyond traditional technology sectors, disrupting a wide range of industries with tailored opportunities:
- Information Technology & Services leads with 158,000 positions, reinforcing its role as the primary incubator of AI talent globally. Cities like San Francisco and Seattle dominate this sector, with numerous postings for AI engineers focused on cloud AI and enterprise solutions.
- Financial Services shows strong adoption with 43,900 positions, highlighted by New York’s rapid growth in AI roles aimed at fraud detection, algorithmic trading, and risk modeling.
- Staffing & Recruiting surprisingly reaches 46,000 positions, underscoring the sector’s pivot to AI-driven talent matching and workforce analytics, with hubs like Chicago gaining momentum.
These examples illustrate how AI adoption varies by industry and geography, inviting regions to consider sector-specific strategies to maximize their competitive advantage. This cross-industry penetration creates opportunities for regions to develop specialized capabilities rather than competing only in generalized tech markets.
See how the Index can be filtered by city, skills, or industry.
Book a demo with our team.
The Compensation Reality: Where Talent Commands Premium
Salary data reveals the economic forces driving AI talent migration and regional competitiveness. AI roles command a national median around $156,000, but regional variations create both arbitrage opportunities and competitive challenges. Research confirms that wages are rising twice as quickly in AI-exposed industries compared to those least exposed, with AI workers commanding a 32% wage premium compared to similar roles without AI skills.
Geographic Examples:
- San Francisco: Premium market reflecting intense talent competition, with Computer Vision specialists averaging $265,000 and 167-day fill times
- Bangalore: Cost-efficient hub demonstrating global arbitrage opportunities while maintaining technical excellence
The full compensation analysis reveals dramatic spreads within and between markets, experience-based salary bands, and industry-specific premiums that influence location decisions. The 10x differential between markets creates opportunities for distributed team strategies while revealing competitive pressures that shape talent migration patterns.
Experience distribution heavily weights toward 0-7 years, indicating that employers prioritize execution capacity and learning agility over extensive theoretical background. This creates opportunities for accelerated training programs and alternative credentialing pathways.
Corporate Intelligence: How the Giants Actually Hire
Platform distribution patterns reveal how sophisticated employers approach AI talent acquisition. Major companies like Meta, Amazon, and Google use distinctly different strategies that provide insights into market dynamics. Multi-platform presence indicates serious hiring commitment; the most successful companies typically maintain presence across 15-33 platforms, demonstrating systematic talent acquisition processes.
AI roles take 77 days to fill versus 60 days for general tech positions, evidence of both talent scarcity and specialized demand. Cities that reduce time-to-hire through better talent pipelines gain meaningful competitive advantages in this environment. With 87% of organizations struggling to hire AI talent and delays costing companies an average of $2.8 million annually, the ability to streamline hiring processes becomes a critical competitive advantage.
The Real-Time Advantage: Why Monthly Data Changes Everything
Monthly resolution provides competitive advantages that annual surveys cannot match. In a market where posting volumes vary 25% quarter-over-quarter and individual cities experience dramatic monthly swings, timing becomes crucial for strategic decision-making.
Real-time intelligence allows stakeholders to:
- Identify opportunities before competitors notice
- Adjust curricula, budgets, or hiring strategies mid-cycle
- Track compensation shifts in time to retain talent
- Time recruitment campaigns to align with peak momentum
With skills expected to change by 70% by 2030 and AI literacy becoming fundamental across all sectors, the ability to respond to real-time market signals determines competitive positioning. Organizations that wait for annual reports find themselves reacting to outdated information in a rapidly evolving market.
The Next Wave of AI Hiring
The AI talent market is evolving beyond generic “AI engineer” roles toward specialized positions such as generative AI operations, MLOps specialists, and AI ethics officers. Data shows that GenAI-specific roles grew 178% year-over-year, with new specializations like Prompt Engineers and LLM Operations Specialists emerging rapidly. Industries like logistics and healthcare are poised for significant AI-driven transformation, requiring domain-specific AI skillsets. Manufacturing and construction, while seeing smaller direct impacts, are driving efficiencies through better capital deployment and process optimization. This specialization trend creates opportunities for regions to develop targeted capabilities that serve specific industry clusters rather than competing in generalized markets. Staying ahead means anticipating these shifts and preparing talent pipelines that reflect future demand, while fostering adaptability and continuous learning as core competencies.
Strategic Response Framework: From Intelligence to Action
Effective response to AI market intelligence requires systematic approaches that align local strengths with documented market opportunities. The job posting data provides the foundation for evidence-based decision-making rather than intuition-driven strategies.
Why Stakeholders Should Care
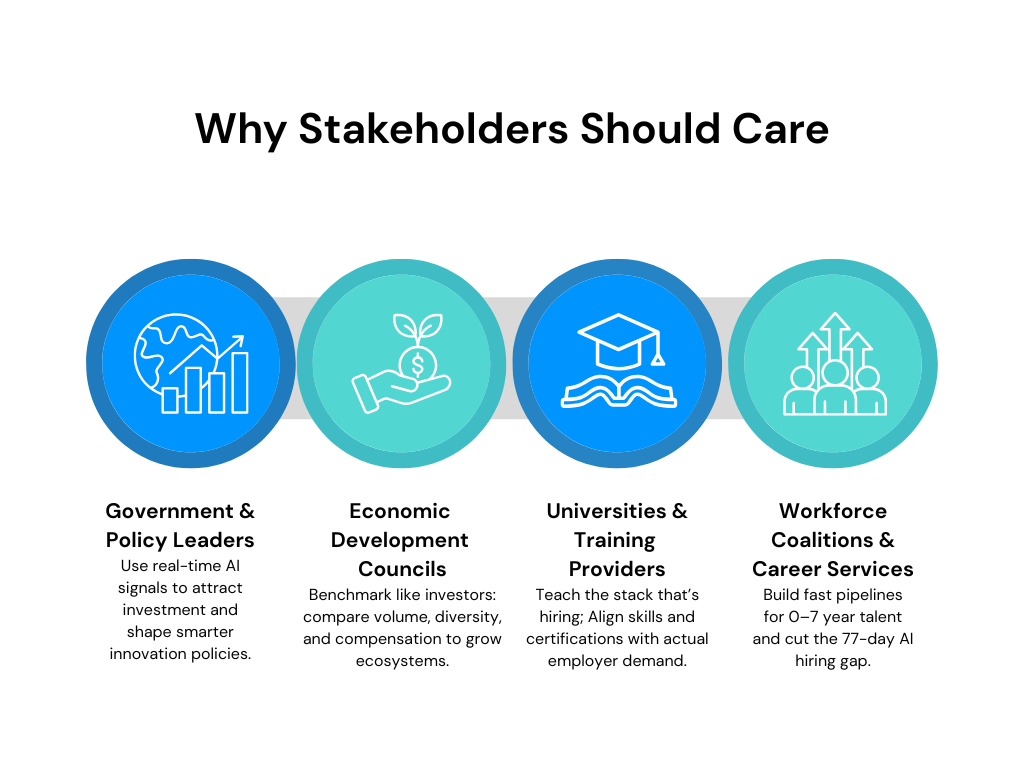
1. For Government & Policy Leaders: Position your city or region to attract global AI investment, justify budget allocations with real data, and create policy that supports sustainable innovation ecosystems. Target by momentum, not headlines prioritize cities with sustained posting growth and platform diversity over one-off spikes. Use local salary intelligence to position regions for appropriate tiers of global team design.
2. For Economic Development Councils: Benchmark like an investor by comparing local posting volume, platform diversity, and compensation competitiveness with peer markets. Build around anchor employers showing multi-platform presence as ecosystem maturity indicators. Create AI incubators and establish industry-academic collaboration that reflects documented market demand.
3. For Universities & Training Providers: Align curricula with actual employer demand, improve graduate placement success, and secure funding by demonstrating industry relevance. Teaching the stack that’s hiring emphasizes the documented skill hierarchy while making soft skills non-negotiable. Offer pathways to high-signal certifications aligned with local employer demand patterns.
4. For Workforce Coalitions & Career Services: Design efficient upskilling pipelines focused on the 0-7 year experience band where demand is highest, measure ROI based on median hiring times, and promote equity in access to AI-related roles. Aim at experience bands where most hiring occurs and design pipelines that move candidates from fundamentals to job-ready in months, measuring success against the 77-day AI median fill time.
The Opportunity Window
The patterns emerging from 953,000 job postings suggest that early positioning advantages compound into permanent competitive gaps. Cities building momentum in AI talent attraction create self-reinforcing cycles that become increasingly difficult to challenge. The economic multiplier effects extend far beyond individual job creation. Each AI professional enables productivity improvements across broader teams, creating indirect impact that can be several multiples of direct employment. Research indicates that every dollar spent on AI solutions generates an additional $4.90 in economic activity, while productivity gains of 2.61% by 2030 are projected to affect 38 million workers in organized sectors alone.
The Choice Is Clear: Regions that act on real-time signals will compound advantage, such as training for skills that get hired, calibrating compensation to win offers, showcasing credible progress to investors and employers. Those waiting for next year’s reports will be reacting to last year’s market.
The AI race is on. Relying on outdated data is already pulling you behind.
Ready to See Where Your City Stands?
The complete JobsPikr AI Readiness Index Report provides:
- Detailed city scorecards and volatility tables
- Comprehensive salary bands and decile distributions
- Full skill taxonomies and certification maps
- Sector-specific adoption patterns
- Strategic implementation frameworks
With JobsPikr, you don’t have to wait for outdated annual reports. Use real-time data at your fingertips to:
- Benchmark your city or region’s AI job demand against global leaders
- Identify skill gaps and high-growth sectors near you
- Track compensation trends to attract and retain top AI talent
- Adjust local education, hiring, and investment strategies based on live signals
Download the Complete AI Readiness Index Report to access granular intelligence and an interactive region-level readiness checker, so you can pinpoint where your locality stands in the global AI race.
Note: This article reveals key insights from the JobsPikr AI Readiness Index Report, based on analysis of 953,000 AI job postings across 106+ platforms in the first half of 2025. The complete Index provides city-by-city scorecards, detailed compensation analysis, and strategic implementation frameworks for regions seeking to capitalize on AI economic opportunities.
See how your region ranks in the global AI race
Schedule a demo and we’ll show you real-time AI hiring data, salary benchmarks, and skill demand patterns to help you make data-driven workforce and economic development decisions.
FAQs
1. How to measure AI readiness?
AI readiness can be measured by evaluating a region, institution, or organization across four core dimensions: talent availability (AI-related job volume and skills), geographic distribution (where hiring is concentrated), industry adoption (which sectors are leading in AI integration), and compensation patterns (what employers are willing to pay). Unlike static surveys, real-time job posting data provides the most accurate measure of actual employer demand.
2. What is the framework for AI readiness?
The framework for AI readiness focuses on demand-side intelligence rather than theoretical potential. It includes:
Volume: the scale of AI-related hiring.
Geographic concentration: hubs and clusters where AI talent demand is highest.
Skill penetration: technical and soft skills employers actively seek.
Industry adoption: how different sectors are deploying AI.
3. What are the correct elements of AI readiness?
The key elements of AI readiness typically include:
Workforce capabilities: availability of technical and business skills.
Infrastructure: cloud, data, and compute resources to deploy AI.
Adoption momentum: industries and regions actively creating demand.
Ecosystem maturity: partnerships, platforms, and employer diversity.
4. How to become AI ready?
Becoming AI ready requires aligning skills, strategy, and infrastructure with market demand. For individuals, this means gaining expertise in high-demand technical areas (machine learning, Python, cloud computing) while also developing business and communication skills. For organizations and governments, it involves building talent pipelines, fostering industry-academic partnerships, and acting on real-time labor market signals rather than outdated reports.
5. How to measure AI maturity?
AI maturity is measured by assessing how effectively AI is integrated into operations and strategy.
Typical benchmarks include:
Pilot vs. production adoption: whether AI projects are experimental or scaled.
Breadth of applications: use of AI across departments and industries.
Talent depth: distribution of skills from entry-level to specialized roles.
Governance and ROI tracking: ability to measure outcomes and manage risks.