- The 2026 Salary Forecast Every Compensation Leader Should Read Before Q3
- Why the 2026 Salary Forecast Looks Nothing Like the Headlines
- See Exactly Where Your Salary Bands Stand Today
- How This Salary Forecast Was Built And Why It Sees Around Corners
- The Roles Most Likely to See Salary Surges in 2026
- The Skills Commanding the Biggest Salary Premiums in 2026
- The Geographies Where Wage Growth Is Outpacing the National Average
- What Wage Inflation in Key Roles Means for Your 2026 Compensation Strategy
- How to Use Real-Time Job Data for Forward-Looking Compensation Planning
- The 2026 Compensation Forecast, in Plain Terms
- Stop Planning Compensation With Yesterday's Data
- Frequently Asked Questions
The 2026 Salary Forecast Every Compensation Leader Should Read Before Q3
Most salary increase budgets for 2026 are holding flat, but that average is hiding some very real surges underneath. Roles in AI, cybersecurity, and cloud infrastructure are seeing wage growth that flat budget headlines simply do not capture. Skills like generative AI and cloud security are commanding premiums that can push total compensation 20 to 56 percent above the baseline for the same job title. Secondary tech markets like Austin, Raleigh, and Nashville are seeing both job growth and wage growth simultaneously, pulling talent away from the coasts. If your compensation strategy is built on last year’s broad benchmarks, you are already behind the roles that matter most heading into the second half of 2026.
Why the 2026 Salary Forecast Looks Nothing Like the Headlines
Most compensation leaders walked into 2026 expecting a quiet year on the pay front. The macro signals seemed to support that reading: hiring had slowed in pockets, salary increase budgets were moderating, and the frantic post-pandemic wage surge felt like it was finally settling. On the surface, a 3.2% to 3.5% average salary increase budget does not exactly sound like something worth losing sleep over.
But here is the problem with averages. They smooth over the parts of the market that are moving and in 2026, some parts of the market are moving fast.
The real 2026 salary forecast is not one story. It is two stories running side by side. The first is a broad, relatively stable market where most roles are getting modest, inflation-adjacent increases and companies are managing headcount carefully. The second is a much more volatile layer underneath, roles in AI engineering, cybersecurity, cloud infrastructure, and a handful of fast-emerging specializations where wage growth is running well ahead of the headline number, posting volumes are climbing, and comp bands built even 12 months ago are already out of date.
That gap between the average and the actual is exactly where compensation strategy tends to break down. When a CHRO sets next quarter’s offer ranges using broad market benchmarks, they are working with a blended number that includes roles where the market has barely moved and roles where it has moved significantly. The result is offers that overshoot in some places and consistently undercut in others and the undercutting tends to happen in the roles that are hardest to fill.
This forecast is built to close that gap. It uses job posting trends as a leading indicator because what companies are actively advertising, and what they are willing to pay to fill those roles right now, tells you more about where compensation is heading than any survey conducted six months ago. Financial services, energy, and high-tech sectors are already projecting total increases of 3.7% while healthcare and retail sit closer to 2.9% and within tech, the variance by role is even wider than the variance by industry.
What follows covers the roles most likely to see salary surges in the next 6 to 12 months, the skills commanding the biggest wage premiums right now, and the geographies where compensation is expanding faster than the national picture suggests. If you are a CHRO, a VP of Talent Strategy, a workforce planning lead, or an HR advisory firm that needs to get ahead of these shifts before your clients ask, this is where to start.
See Exactly Where Your Salary Bands Stand Today
Don’t wait for your next annual review cycle to find out your offers are behind the market.
How This Salary Forecast Was Built And Why It Sees Around Corners
Most compensation forecasts are built backwards. They collect what companies paid last year, average it out, and call it a prediction. That is not forecasting; that is reporting with a delay. A genuine salary forecast needs leading indicators, data that tells you where compensation is heading before it gets there. Job posting data is one of the best available signals for exactly that reason.
Here is the logic: when a company opens a requisition and attaches a salary range to it, that number is not historical. It is a live decision made by someone with a budget, a deadline, and a real competitive market to contend with. When you track those decisions at scale across millions of postings, updated in real time, you get a picture of compensation intent that is months ahead of what any annual survey can show you.
Why Job Postings Are a Leading Indicator of Wage Growth
The relationship between posting volume and salary movement is consistent. When demand for a role starts climbing, more companies open requisitions, posting velocity accelerates, and compensation tends to follow within one to two quarters. Employers start stretching their ranges to attract a shrinking pool of qualified candidates. Offers creep upward. Eventually, the posted salary ranges reflect the new market reality, and by the time that shows up in a compensation survey, the move has already happened.
This is why posting growth is one of the most reliable early signals in workforce intelligence. It does not tell you exactly what salaries will be in six months, but it tells you which roles are about to become more expensive to fill, and that is the question that matters most for compensation planning.
What the Data in This Forecast Covers
This forecast draws on a combination of live job posting trends, published labor market research, and compensation data from sources including the Bureau of Labor Statistics, PwC’s 2025 Global AI Jobs Barometer, Payscale, Mercer, Robert Half, Lightcast, and WorldatWork. Where salary ranges are cited, they reflect current posted ranges from active job listings rather than self-reported survey averages.
The forecast covers three primary dimensions that together give you a forward-looking read on compensation:
- Posting growth by role: which job titles are seeing the fastest increase in demand, and what does that signal for salary movement over the next two to three quarters?
- Skills premiums: which specific skills, when listed in a job description, are associated with meaningfully higher offered salaries for the same role title?
- Geographic expansion: which metros are seeing simultaneous growth in both posting volume and offered compensation, pointing to emerging competitive markets that your location-based pay bands may not yet reflect.
The Problem with Relying Only on Annual Surveys
It is worth being direct about why the traditional benchmarking process struggles to keep up with the kind of shifts this forecast is tracking.
Standard compensation surveys operate on annual or semi-annual cycles. Data is collected, cleaned, validated, and published in a process that can take six to nine months from collection to delivery. By the time a comp team applies that data to an offer approval, the underlying market may have moved by a meaningful margin. In stable labor markets, that lag is manageable. In fast-moving specializations like AI engineering or cloud security, a 12-month-old benchmark is not a slightly imperfect tool it is actively misleading.
More than 8 out of 10 employers distribute their salary increase budgets equally across the organization rather than directing resources toward high-demand skills or critical market gaps, according to Mercer. That approach works reasonably well when the market is moving uniformly. It breaks down badly when specific roles and skills are pulling away from the rest which is exactly the pattern the 2026 data is showing.
At a Glance: 2026 Compensation Signals by Category
The table below summarizes the three forecast dimensions: roles, skills, and geographies, along with the signal strength and the likely direction of salary movement over the next two to three quarters.
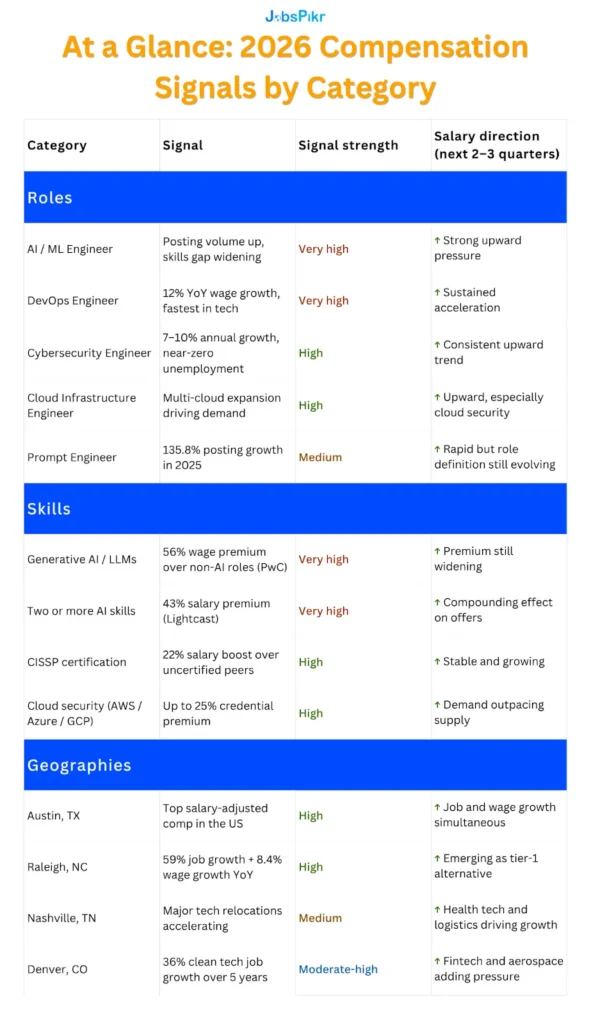
The table above gives you a quick-reference view of the three forecast dimensions, roles, skills, and geographies that the rest of this article unpacks in detail. Signal strength reflects the volume and consistency of the data pointing in that direction. Every category in this forecast is trending upward, but the pace and the timeline differ by role and location, which is why granular intelligence matters more than headline averages.
The Roles Most Likely to See Salary Surges in 2026
If you manage compensation for a large organization, the single most expensive mistake you can make right now is treating all tech roles the same way in your pay planning. The 2026 labor market is not rewarding generalists across the board it is concentrating salary growth in a specific set of roles where demand is outpacing supply fast enough to move comp bands in real time. Here is where the surges are happening.
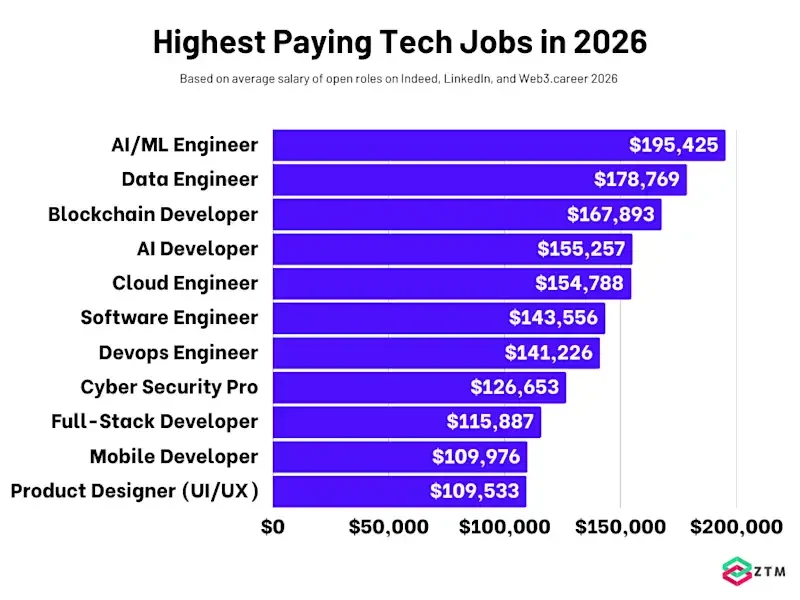
Image Source: zeromastery
DevOps Engineers: The Fastest Wage Growth in All of Tech
This one tends to surprise people. The headline AI roles get the attention, but right now, DevOps engineers are seeing the fastest wage growth of any role tracked in the tech sector. Payscale’s 2025 End of Year Top Jobs Report found DevOps Engineers leading overall wage growth at 12% year-over-year, with a median salary of $131,000.
The reason is straightforward once you think about it. DevOps engineers do not just write code they keep production systems running, they bridge the gap between development velocity and operational stability, and they sit at the intersection of everything companies are investing in right now: cloud infrastructure, CI/CD pipelines, and increasingly, the deployment layer for AI systems. That combination of skills is genuinely hard to find in one person, and the market is pricing that scarcity accordingly.
Robert Half’s 2026 Salary Guide puts the mid-range salary for DevOps Engineers at $145,750, a 2.3% increase from the prior year but that figure understates the real movement at the senior end, where candidates with cloud platform expertise and AI infrastructure experience are commanding significantly more. If your DevOps comp bands were last updated more than 12 months ago, they are almost certainly out of step with what the market is actively offering.
AI and Machine Learning Engineers: The Premium Is Still Widening
The AI engineering salary surge is not new, but what is worth paying attention to heading into the second half of 2026 is that the premium is still accelerating rather than flattening. PwC’s 2025 Global AI Jobs Barometer, based on analysis of close to a billion job ads from six continents, found that roles requiring AI skills command an average 56% wage premium over similar roles without those skills up from 25% just one year earlier.
That doubling of the premium in a single year is the kind of signal that should prompt a compensation review, not a note to revisit at the next annual cycle. Jobs requiring AI skills also grew 7.5% from the prior year even as total job postings fell 11.3% which means demand for these roles is holding firm in a market where overall hiring has softened. That dynamic tends to push salaries up, not down.
Within AI engineering, the highest salary pressure right now sits in roles that can take a foundation model and make it work in production fine-tuning, retrieval-augmented generation pipelines, model evaluation, and deployment at scale. These are not entry-level skills, and the pool of people who have done this work in a real production environment remains very small relative to how many companies now need it.
Cybersecurity Engineers: Quiet, Consistent, and Accelerating
Cybersecurity does not generate the same breathless coverage as AI, but from a pure compensation trajectory standpoint, it is one of the most consistent salary surge stories in the 2026 data. Cybersecurity salaries are growing at 7 to 10% annually, substantially exceeding inflation and general wage increases, with the median reaching approximately $120,000 in 2025 nearly double the US national median.
What is driving this is a combination of factors that are not going away anytime soon. Cyberattacks are increasing in sophistication and frequency. Regulatory requirements are tightening across industries. And the global cybersecurity workforce gap estimated at 4.8 million unfilled positions globally means employers are competing hard for a talent pool that is structurally undersupplied.
Some specific sub-roles within cybersecurity are seeing even sharper movement. Advertised salaries for Information Systems Security Engineer roles grew 13% over the past 12 months, according to data. Cloud security engineers, DevSecOps specialists, and threat intelligence analysts are all seeing above-average movement within an already above-average sector. Cybersecurity compensation packages overall are seeing average annual increases of 8 to 11% compared to the 2024–2025 period, outpacing inflation in most major economies.
For comp teams, the practical implication is that cybersecurity roles need to be treated as a separate compensation category from general IT because they are no longer moving at the same pace.
Prompt Engineers: Explosive Growth, But Read the Fine Print
Demand for Prompt Engineers grew 135.8% in 2025, according to Autodesk’s AI Jobs Report. That number is real, and it reflects genuine market demand. But it comes with an important asterisk that matters a lot for salary benchmarking: the role definition is still highly variable.
“Prompt engineer” in one job posting can mean a highly technical specialist building LLM evaluation frameworks and fine-tuning pipelines. In another posting, it means someone using ChatGPT to draft marketing copy more efficiently. Both get the same job title in the data, but the salary ceiling is dramatically different. The former competes with AI engineering compensation; the latter sits closer to a content or operations role.
This does not mean you should dismiss the role in your workforce planning, quite the opposite. It means your comp band for prompt engineering needs to be built on a clear internal definition of what the role requires and benchmarked against postings that match that definition, rather than the category as a whole. The growth signal is strong. The benchmarking just requires more precision than most other titles right now.
Cloud Infrastructure Engineers: The Invisible Salary Surge
Cloud infrastructure engineers tend to fly under the radar in compensation conversations because they do not have the cultural cachet of AI researchers or the high-profile shortage narrative of cybersecurity. But the salary data tells a different story. As organizations accelerate multi-cloud adoption and move AI workloads into production, the demand for engineers who can build, secure, and optimize cloud infrastructure is growing steadily, and compensation is moving with it.
Financial services, energy, and high-tech sectors, all heavy cloud infrastructure investors, are projecting total salary increases of 3.7% compared to the broader market average of 3.2 to 3.5%, and cloud infrastructure roles are a meaningful driver of that above-average movement within those sectors. Cloud security specialization adds an additional premium on top of the base role with cloud security credentials adding up to 25% to advertised salaries for engineers who combine infrastructure and security expertise.
What This Means for Your Comp Strategy
The roles listed above share a common thread: they all sit at the intersection of something companies urgently need and something the talent market cannot supply fast enough. That combination of urgent demand and constrained supply is the most reliable driver of salary surges, and it is why these roles keep moving even when overall compensation budgets are flat.
The practical implication for compensation planning is not to throw your entire comp structure out and rebuild it around these roles. It is to carve them out of your standard annual review cycle and put them on a faster cadence. If you are refreshing your AI engineering, DevOps, and cybersecurity comp bands once a year, you are almost certainly working with numbers that are already behind the market by the time you apply them.
The Skills Commanding the Biggest Salary Premiums in 2026
Role titles only tell part of the story. Two people with the same job title, at the same seniority level, in the same city, can have a $30,000 to $50,000 gap in their offered salary, and the difference almost always comes down to the specific skills listed in the job description. This is where compensation benchmarking gets genuinely useful, because once you understand which skills are moving the needle on pay, you can build smarter bands, write better job descriptions, and understand exactly what you are paying for when you make an offer.
The 2026 data on skills premiums is one of the clearest signals in this entire forecast. Certain skills are not just nice to have on a resume anymore, they are structurally repricing the roles they appear in.
Image Source: lockedinai
Generative AI Skills: The Largest Premium in the Modern Labor Market
There is no skills premium story in 2026 that comes close to what generative AI expertise is doing to compensation across the board. PwC’s 2025 Global AI Jobs Barometer, drawing on close to a billion job ads across six continents, found that roles requiring AI skills carry an average 56% wage premium over similar roles without those skills, up from 25% just one year prior. That is not a rounding error. That is the premium, more than doubling in twelve months.
To put that in concrete terms: if a standard data analyst role in your organization pays $90,000, a version of that same role requiring generative AI skills could be sitting at $140,000 or more in the current market. The premium is not confined to AI-native roles either. Since ChatGPT launched in late 2022, job postings mentioning generative AI skills have grown 800% for non-tech roles meaning marketing, finance, HR, and operations functions are all competing for people with these skills, pulling compensation upward across industries simultaneously.
For compensation teams, this creates a specific problem that is easy to miss. If your job architecture treats “Data Analyst” as a single benchmark regardless of skill requirements, you are almost certainly underpaying the people on your team who are doing AI-augmented work and you will not find out until they leave.
The Compounding Effect of Multiple AI Skills
The skills premium gets even more interesting when you look at what happens when a candidate brings more than one AI-related skill to the table. Analysis of 1.3 billion job postings found that roles requiring at least one AI skill advertised salaries 28% higher on average, roughly $18,000 more per year. For roles requiring two or more AI skills, that premium climbs to 43%.
That compounding dynamic matters for how you think about your job descriptions. When you write a posting that requires both LLM experience and cloud deployment knowledge, you are not just adding requirements you are signaling to the market that you are competing for a much smaller candidate pool, and the salary expectation attached to that pool is meaningfully higher. If your approved budget for that role was based on a single-skill benchmark, you have a gap before you even post.
The practical fix is straightforward but requires discipline: every time a job description adds a specialized AI skill requirement, it should trigger a comp review of the posted range, not just a copy-paste from the last time you hired for that title.
Cloud Security Credentials: The Certification That Pays for Itself Fast
Outside of AI, cloud security certifications are generating some of the most consistent and measurable salary premiums in the 2026 data. Cloud security credentials, AWS, Azure, and GCP security specializations, add up to 25% to advertised salaries for engineers who combine infrastructure and security expertise. For a cloud infrastructure engineer at the mid-level, that 25% can represent $25,000 to $35,000 in additional annual compensation.
This premium is being driven by a supply problem that is not resolving quickly. Most cloud engineers have platform knowledge. Significantly fewer have the security architecture expertise to design and maintain compliant, resilient cloud environments across multiple providers. As organizations run increasingly critical workloads on cloud infrastructure and as regulators apply more scrutiny to how those environments are secured, the gap between what a generalist cloud engineer can do and what a cloud security specialist can do becomes more expensive to ignore.
For comp teams managing cloud engineering bands, this means a single salary range for “cloud engineer” is probably doing too much work. The spread between a generalist and a certified cloud security specialist is wide enough that they arguably belong in separate benchmark categories.
CISSP and Advanced Cybersecurity Certifications: A Measurable, Defensible Premium
Cybersecurity certifications have long been associated with salary bumps, but the 2026 data gives those bumps more precision than most compensation teams have worked with before. CISSP certification adds a 22% salary boost over uncertified peers, cloud security credentials add up to 25%, and even the entry-level Security+ certification adds 11% for professionals earlier in their careers.
What makes these premiums particularly useful for compensation planning is that they are attached to verifiable credentials rather than subjective skill assessments. When a candidate holds a CISSP, you have a concrete signal about the depth of their security knowledge and the market has priced that signal consistently. That consistency makes it easier to build defensible comp bands and explain offer decisions internally, which matters more than ever as pay transparency requirements expand.
Certified cybersecurity professionals have a 37% pay advantage over non-certified colleagues overall, which is one of the strongest certification-to-salary correlations in any technical field right now. For organizations that are serious about building a cybersecurity team and retaining it, factoring certification status into your comp bands is not optional it is what the market already assumes you are doing.
AI Skills Beyond Engineering: The Cross-Functional Premium That Catches Teams Off Guard
One of the more underappreciated dynamics in the 2026 skills premium data is how far the AI wage premium has spread beyond technical roles. A report identified over 300 distinct AI skills across their job posting analysis, and found that the demand for AI skills was actually higher in non-tech sectors than in IT and computer science. Marketing and public relations came in second only to IT and computer science in demand for AI skills, followed by science and research, and social analysis and planning.
This matters for compensation strategy in a way that often catches HR teams off guard. The premium for AI skills is not just a tech team problem. It is showing up in marketing, finance, operations, and HR roles as well. If your compensation benchmarking treats AI skills as relevant only to your engineering org, you are likely underpaying people in other functions who are doing AI-augmented work, and you will not see it coming until those roles start experiencing attrition you cannot explain.
The most forward-thinking organizations are already running skills audits across functions to identify where AI capability has quietly become a core requirement and adjusting their comp bands accordingly. It is a more complex exercise than a standard benchmark refresh, but it is the kind of work that prevents the quiet compensation drift that tends to surface as turnover rather than as a comp audit finding.
A Note on Skills Premiums and Internal Equity
One consequence of rapid skills premium growth that deserves more attention than it usually gets is what it does to internal equity. When the market starts paying significantly more for a specific skill, new hires with that skill come in at higher salaries often above what tenured employees in adjacent roles are earning. That compression creates friction fast, and it is rarely the new hire’s fault.
More than 8 out of 10 employers distribute their salary increase budgets equally across the organization rather than directing more resources toward high-demand skills or critical market gaps, according to Mercer. That approach does not hold up well in a market where a single skill can shift the benchmark by 20 to 56 percent. If your comp review process does not include a mechanism for surfacing and addressing skills-driven compression, you are likely building an internal equity problem with every new AI or cybersecurity hire you make.
The Geographies Where Wage Growth Is Outpacing the National Average
The national compensation average is probably the least useful number in your benchmarking toolkit right now. Not because it is wrong, but because it obscures a geographic story that is arguably more important for workforce planning than any role-level or skills-level data. Where your roles are located or where your candidates are based, if you hire remotely, can shift the salary expectation for the exact same position by $30,000 to $50,000 or more. And in 2026, the cities driving that variance are not always the ones you would expect.
The traditional assumption was simple: coastal tech hubs pay the most, and everyone else adjusts down from there. That model is breaking down. A new pattern is emerging where secondary markets are seeing simultaneous growth in both job posting volume and offered compensation, meaning they are not just cheaper alternatives to San Francisco anymore. They are becoming genuinely competitive markets in their own right, with their own salary floors and their own upward pressure.
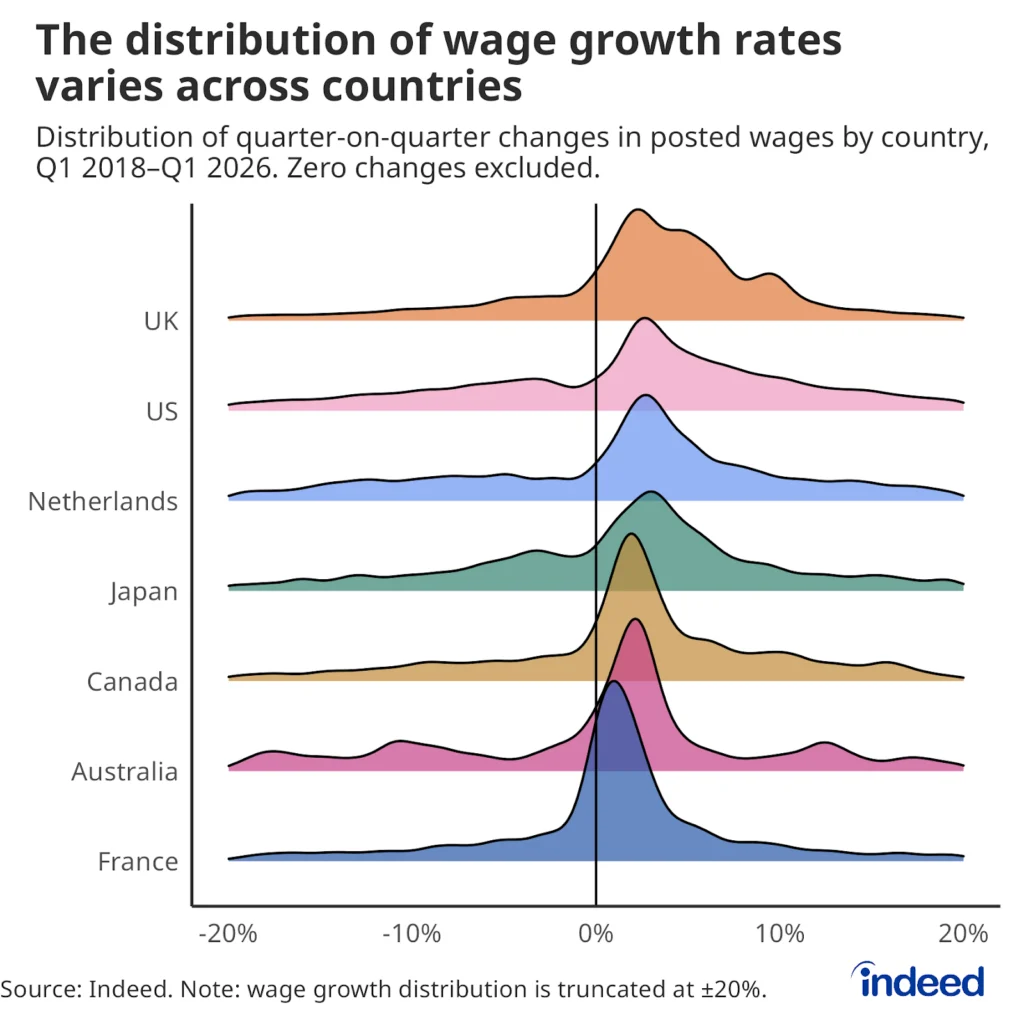
Image Source: Hiringlabs
Why Secondary Markets Are Closing the Gap
The shift toward secondary tech markets has been building for several years, but the 2026 data suggests it has moved from a trend into a structural reality. Major corporate relocations have played a significant role. Oracle’s move to Nashville, Tesla’s Austin expansion, and Micron’s Boise growth represent billions in economic impact and thousands of direct jobs — and when anchor employers of that scale move into a market, they pull compensation upward for every other employer competing for the same talent pool.
The remote work shift accelerated this dynamic considerably. When candidates realized they could access high-paying remote roles without relocating to San Francisco or New York, talent started concentrating in cities that offered a better quality-of-life trade-off. That concentration of talent then attracted more employers, which created local competition for that talent, which pushed local salaries up. The cycle has been running for a few years now, and in several secondary markets it has reached the point where you can no longer assume a meaningful discount relative to coastal rates.
Austin, Texas: The Benchmark for Secondary Market Salary Growth
Austin has moved well past the point of being called an emerging market. It is fully emerged. Austin ranks as the top city in the US for salary-adjusted compensation for tech professionals, scoring 95 out of 100 on the HOMEiA Tech Opportunity Score the highest rating of any city analyzed. The combination of competitive nominal salaries, no state income tax, and a cost of living significantly below coastal hubs means that the real earnings power for tech professionals in Austin now rivals or exceeds what they would take home in San Francisco or New York after accounting for taxes and housing.
For compensation teams, this has a specific implication. If you are hiring remote workers in Austin and applying a coastal-minus adjustment to their salary, you may be working from an assumption that no longer reflects what local employers are offering. The Austin talent market is competitive in its own right now, and the adjustment you think you are making may be smaller than the gap between your offer and the next one your candidate receives.
Raleigh-Durham, North Carolina: The Fastest-Rising Market in the Data
If one city stands out in the 2026 geographic wage data for the sheer pace of its movement, it is Raleigh. Raleigh, NC saw 59% job growth alongside 8.4% wage growth year-over-year, with an average cybersecurity salary of $129,000, and that is just one role category in one city. The broader pattern across tech and knowledge-work roles shows Raleigh consistently posting some of the highest simultaneous job and wage growth numbers of any metro in the country.
The Research Triangle ecosystem, the concentration of research universities, established tech employers, and a steady pipeline of graduate talent, has been building toward this for years. Apple, Google, IBM, and Cisco are among the major employers actively hiring in the Raleigh market, which means candidates in the area are benchmarking their salary expectations against what those companies are offering, not against what a regional employer might have paid three years ago. When the anchor employers in a market are global tech giants, the comp floor rises for everyone.
Raleigh-Durham ranks 93 out of 100 on the HOMEiA Tech Opportunity Score, making it the second-highest rated city in the US for salary-adjusted tech compensation. For workforce planners weighing whether to build headcount in a secondary market, that combination of high adjusted compensation and strong job growth is exactly the signal that suggests a market is becoming harder to discount in your comp bands.
Nashville, Tennessee: The Dark Horse With Real Momentum
Nashville gets mentioned frequently in workforce planning conversations, but it is still underrepresented in most compensation benchmarking frameworks which is exactly the kind of gap that creates problems when you start hiring there. The city’s tech growth is no longer driven just by healthcare IT, though that sector remains strong. Major corporate relocations have diversified the employer base considerably, and Oracle’s Nashville move in particular has had a measurable effect on local compensation expectations across tech roles.
The purchasing power argument for Nashville is also genuinely compelling in a way that matters for talent attraction. A $95,000 salary in Nashville provides more buying power than $120,000 in San Francisco which means Nashville-based candidates are not necessarily asking for less. They are often making a rational financial decision that puts them ahead in real terms. For employers, that dynamic creates an opportunity: you can offer competitive real compensation at a lower nominal cost than coastal hiring, but only if your comp bands reflect what the Nashville market is actually paying, not a blanket discount from a national average.
Denver, Colorado: Clean Tech and Fintech Driving a Dual Surge
Denver is a slightly different story from the other secondary markets in this forecast because its salary growth is being driven by two distinct industry forces rather than one. Denver’s net tech employment is expected to grow 3.2% with an overall job growth surge of 45% projected over the next ten years, significantly higher than the US average of 33.5% and the sectors powering that growth are clean technology and fintech, both of which carry above-average compensation benchmarks.
Denver has seen a 36% increase in clean tech jobs over the past five years, and the city’s aerospace sector adds another layer of demand for engineering and data roles that pull compensation upward. The practical effect for comp teams is that Denver can no longer be treated as a straightforward discount market relative to coastal hubs especially for roles in data engineering, cloud infrastructure, and fintech-adjacent functions where local demand is genuinely competitive.
The Remote Work Wrinkle That Comp Teams Keep Getting Wrong
Any geographic compensation analysis in 2026 has to grapple with remote work, because the location-based pay model that most enterprises built their comp bands around is under real pressure. The assumption that you can apply a geography-based discount to remote workers in lower-cost markets is running into two problems simultaneously.
The first is that the lower-cost markets are not as low-cost as they used to be, for the reasons outlined above. The second is that location-based pay cuts have become a meaningful candidate deterrent. Research shows that no-remote roles see roughly 45% fewer qualified applicants than their remote-friendly equivalents and aggressive location-based pay adjustments are producing a similar filtering effect, particularly among senior candidates who have options and know it.
The smarter approach that is emerging among organizations winning the talent competition in secondary markets is to calibrate pay bands to role impact rather than zip cod, with regional adjustments that reflect actual local market conditions rather than a formula applied from headquarters. That requires better geographic data than most annual benchmarking processes provide, which is where live job posting data becomes particularly useful. You cannot manage a geographic compensation strategy on data that is 12 months old when the markets themselves are moving quarter to quarter.
What Wage Inflation in Key Roles Means for Your 2026 Compensation Strategy
Data without a decision attached to it is just interesting reading. The role surges, skills premiums, and geographic shifts covered in this forecast only matter if they change something about how you plan, approve, and review compensation. This section is about that translation taking what the market is telling you and turning it into a practical comp strategy that holds up through the second half of 2026 and into 2027.
The core tension most compensation leaders are navigating right now is this: overall salary budgets are flat to modestly declining, while specific pockets of the market are experiencing wage inflation that flat budgets simply cannot accommodate across the board. Something has to give, and the organizations that manage this well are making deliberate choices about where to concentrate their limited budget rather than spreading it evenly and losing talent in the roles that matter most.
Stop Treating All Tech Roles the Same in Your Annual Review Cycle
This is the most common structural mistake in enterprise compensation planning right now, and it is costing organizations more than they realize. The standard annual comp review cycle collect benchmarks once a year, update bands, apply increases uniformly was built for a labor market that moved at a relatively uniform pace. That market no longer exists, at least not in tech.
DevOps Engineers are seeing 12% year-over-year wage growth. Cybersecurity compensation is growing at 7 to 10% annually. The AI skills premium more than doubled in a single year. None of those movements fit inside a 3.2 to 3.5% average increase budget, and none of them should be reviewed on the same annual cadence as roles where the market is genuinely stable.
The fix is not complicated, but it requires political will inside the organization. Carve out your high-surge roles AI engineering, DevOps, cybersecurity, cloud security into a separate compensation review category with a quarterly or at minimum semi-annual refresh cycle. Build the business case for that separation using the market data. When you can show a CHRO or a CFO that a specific role category is experiencing double-digit wage inflation while the rest of the market sits at 3%, the argument for a differentiated review cadence becomes a lot easier to make than a general request for more budget flexibility.
Build the Internal Equity Audit Into Your Hiring Process, Not After It
One of the quieter but more damaging consequences of the skills premium surge is what it does to pay equity inside your existing teams. Every time you bring in a new AI engineer or cybersecurity specialist at the market rate which is significantly higher than it was 18 months ago — you create potential compression against the people who have been doing similar work for longer and were hired at a lower market rate.
More than 8 out of 10 employers distribute their salary increase budgets equally across the organization rather than directing more resources toward high-demand skills or critical market gaps, according to Mercer. That uniform distribution approach means the internal equity gap created by a new high-market hire is rarely addressed proactively it accumulates quietly until someone on your existing team figures out the delta and starts looking.
The organizations handling this well have built a simple trigger into their offer approval process: before any offer is approved for a high-surge role, a comp analyst runs the current team’s compensation against the same market data being used to set the offer. If there is a meaningful gap and right now there often is the question of whether to address it gets raised before the new hire starts, not six months later when retention becomes the problem. It is a small process change that prevents a much larger and more expensive problem downstream.
Use Flexible Compensation Structures to Stretch a Flat Budget Further
When your overall salary budget is constrained but specific roles are experiencing real wage inflation, pure base salary increases are often the least efficient tool available to you. They are permanent, they compound, and they are visible in ways that create expectations elsewhere in the organization. The smarter approach in a bifurcated market is to build flexibility into how you structure compensation for high-surge roles specifically.
Retention bonuses with reasonable vesting windows, equity refresh grants tied to project milestones, and performance-based quarterly bonuses can often close a competitive gap more efficiently than a flat base increase and they give you more room to adjust if market conditions shift. This is not a novel idea, but it is one that many enterprises have been slow to apply specifically to the roles experiencing the most wage inflation, partly because the comp architecture for those roles was built when the market was more uniform.
The principle at play here is straightforward. Financial services, energy, and high-tech sectors are already projecting total salary increases of 3.7% above the broad market average — in part because those industries have figured out that the cost of losing specialized talent is higher than the cost of paying above the average budget to retain it. If your organization operates in one of those sectors and your comp strategy is still anchored to the broad market average, you are already conceding ground to competitors who have done that math.
Watch These Three Warning Signs That Your Benchmarks Are Already Stale
There are specific, observable signals that tell you your compensation data is no longer serving you well and they tend to show up before your HR analytics dashboard makes them obvious. If you are seeing any of these patterns, the benchmarks driving your offer decisions deserve an immediate review.
The first is offer decline rates creeping upward for specific role categories without a clear explanation from candidates about why. Compensation is rarely the stated reason for a declined offer candidates tend to cite cultural fit or career growth but when declines cluster in your AI, DevOps, or cybersecurity pipelines specifically, the common denominator is almost always the number. Your declined candidates are accepting offers elsewhere, and those offers are higher.
The second is time-to-fill stretching for high-surge roles even when your sourcing volume has not changed. A longer hiring funnel in a specific role category usually means candidates are running parallel processes and accepting faster elsewhere. That acceleration elsewhere is almost always driven by a more competitive offer, which points back to your comp bands being behind the market.
The third is when your existing team starts surfacing what their network is being offered by other employers. Engineers and cybersecurity professionals have strong professional networks and, in a hot market for their skills, regularly hear about competitive offers. When those conversations start happening internally, when your AI engineers or DevOps leads are mentioning what their peers are being offered elsewhere, that is a direct market signal that your retention risk has climbed and your current comp bands need a serious look.
The Pay Transparency Tailwind You Should Be Using, Not Avoiding
One structural shift that is quietly making compensation planning both harder and more tractable at the same time is the rapid expansion of pay transparency legislation. More companies are required to disclose salary ranges in job postings, which means there is more real market data available than at any prior point but it also means your own ranges are more visible to candidates and current employees than they used to be.
The organizations that are turning this into an advantage are using the increased availability of disclosed salary ranges to sharpen their own benchmarking, building comp bands that they are genuinely comfortable defending publicly rather than ranges that are optimized to pass internal review. That discipline-building range you would be comfortable posting tends to produce better compensation strategy than ranges built to satisfy a budget process. It also reduces the internal equity risk that comes from candidates and employees comparing notes on what the market is offering versus what your organization is paying.
Pay transparency is not going away. The EU Pay Transparency Directive is being transposed into national laws, and tighter regulations are emerging in Canada, Australia, and across US states. The comp teams that treat this as a compliance headache are missing the strategic opportunity embedded in it: better disclosed data in the market means better inputs for your benchmarking, which means better comp decisions if you have the right infrastructure to use that data in real time.
How to Use Real-Time Job Data for Forward-Looking Compensation Planning
Everything covered in this forecast, the role surges, the skills premiums, the geographic shifts, is only as useful as the data infrastructure you have to act on it. And this is where most enterprise compensation processes have a structural gap that is worth being direct about.
The insight that DevOps wages are growing at 12% year-over-year is not actionable if you are working from a benchmarking dataset that was compiled eight months ago. The knowledge that Raleigh is seeing simultaneous job and wage growth does not help your offer approval process if your location-based pay bands are updated once a year from a survey your vendor publishes in Q1. The data needs to be live, specific, and connected to real decisions not filed in a folder until the next planning cycle.
This is the gap that real-time job posting data is built to close.
Why Job Posting Data Works as a Forward-Looking Compensation Tool
When a company posts a role with a salary range attached, that number is not a historical artifact. It is a live decision made by someone with a budget, a hiring deadline, and a real competitive market to navigate. Aggregated across millions of postings and updated continuously, those decisions become a compensation signal that is months ahead of what any annual survey can show you.
The mechanism is straightforward. Posting volume for a role starts climbing before salary ranges move because the initial response to demand growth is to open more requisitions, not immediately raise pay. Then, as the qualified candidate pool gets thinner relative to open roles, offered ranges start stretching upward. By the time that movement shows up in a traditional compensation survey, it has already been happening in the posting data for one to two quarters.
That lag is exactly what live posting data eliminates. Stanford’s 2025 AI Index Report found that the share of US job postings requiring AI skills climbed to 1.8%, up from 1.4% in 2023 a signal that was visible in posting data well before it showed up in compensation survey results. Organizations that were watching posting trends had a head start on adjusting their AI comp bands. Organizations relying on annual surveys were catching up after the fact.
What Good Real-Time Benchmarking Actually Looks Like in Practice
Real-time salary benchmarking is not just about having fresher data. It is about changing how compensation decisions get made throughout the year not just during the annual review cycle.
In practice, it means your offer approval workflow has a live data check built into it. Before a hiring manager submits a comp recommendation for an AI engineer role in Austin, someone on the comp team can pull the current posted salary distribution for that title in that city the floor, the median, the 75th percentile, and how those numbers have moved over the last 90 days. That is a fundamentally different conversation than checking a benchmark report that was published in February.
It also means your retention risk monitoring has a data feed. Rather than waiting for exit interviews to surface compensation as a concern, you can run your current team’s salaries against live market data for their roles and locations on a regular cadence — flagging anyone who has drifted meaningfully below the market median before they start a job search.
And it means your workforce planning has a forward-looking signal built in. When posting volume for a role category starts climbing in a specific geography say, cybersecurity engineers in Raleigh, that is a leading indicator that compensation pressure in that market is likely to follow. You can get ahead of it rather than react to it.
How JobsPikr’s Salary Benchmarking Works
JobsPikr tracks and structures job postings from across the web in real time, normalizing role titles, salary ranges, location data, and skill requirements into a consistent, queryable format. That means when a comp team needs to know what AI engineers are being offered in Denver right now not six months ago the answer is already in the data.
The salary benchmarks it produces are not averages of self-reported numbers from a survey sample. They are derived from what employers are actively advertising, which means they reflect current market conditions rather than what HR leaders remembered reporting during a survey intake process last spring. The difference sounds subtle, but in a market moving as fast as AI and cybersecurity compensation, it is the difference between making competitive offers and losing candidates you do not fully understand why you are losing.
You can see exactly how the salary benchmarking works in the demo below including how to filter by role, location, and skill requirements to get the specific data points your comp decisions need.
When a Salary Calculator Is Not Enough
A salary calculator is a useful starting point when you need a quick directional number checking whether a candidate’s expectation is roughly in range before you invest heavily in an interview process, for example. But for decisions that matter, it is not the right tool.
Setting comp bands, planning headcount budgets, adjusting offers in a competitive process, auditing pay equity across a team these decisions need the distribution, not just the midpoint. They need to know the floor and the ceiling, how the range shifts by seniority level, what the 75th percentile looks like in a specific city, and how those numbers have moved over the last quarter. A calculator built on static inputs gives you a single point estimate. Live benchmarking data gives you the full picture needed to make a decision you can defend.
The shift toward real-time benchmarking is not a niche practice anymore. Pay equity and transparency are top priorities for global employers in 2026, driven by expanding legislation and employee expectations that have permanently raised the bar for how compensation decisions need to be documented and defended. The infrastructure you build to stay compliant is the same infrastructure that makes your comp strategy smarter if you invest in data that is current enough to be useful.
The 2026 Compensation Forecast, in Plain Terms
The headline number a 3.2 to 3.5% average salary increase budget, is not wrong. It is just incomplete. It describes the middle of the market accurately while telling you almost nothing about the edges, and in 2026, the edges are where the real compensation story is playing out.
DevOps engineers are seeing 12% wage growth. The AI skills premium doubled in a year and now sits at 56% above comparable roles without those skills. Cybersecurity compensation is growing at 7 to 10% annually against a backdrop of near-zero unemployment in the sector. Secondary markets like Austin, Raleigh, and Nashville are seeing simultaneous job growth and wage growth that makes them genuinely competitive with coastal hubs rather than simply cheaper alternatives.
The companies that hire and retain the best people in these categories in 2026 are not necessarily the ones with the biggest budgets. They are the ones with the most accurate, most current picture of what the market looks like right now by role, by skill, by city, and by seniority level. That accuracy is what turns a compensation strategy from a reactive cost management exercise into a genuine competitive advantage.
If your comp bands are being set on annual survey data, your offer approval process has no live market check, and your retention monitoring does not have a real-time feed — the forecast in this article is useful context, but it is not a substitute for the infrastructure that makes acting on it possible.
That is what JobsPikr is built for. Schedule a demo to see how live job posting data translates into smarter compensation decisions across your organization.
Stop Planning Compensation With Yesterday’s Data
The market is moving faster than your annual benchmarks can keep up. See how JobsPikr’s live job posting intelligence gives your team a real-time view of salary trends, by role, skill, and city.
Frequently Asked Questions
1. What does the 2026 salary forecast mean for companies that are not in tech?
The salary forecast matters for every organization that competes for tech-adjacent talent which in 2026 is essentially every large enterprise. Finance, healthcare, manufacturing, and retail organizations are all hiring data engineers, cybersecurity professionals, and AI-adjacent roles, which means they are competing in the same talent market as tech companies even if they do not think of themselves that way. The wage premiums for AI skills and cybersecurity certifications apply regardless of your industry, because your candidates have offers from companies across sectors. If your benchmarking is industry-specific but your talent competition is not, your comp bands will be systematically behind the market for the roles that matter most.
2. How often should compensation bands be reviewed for high-surge roles in 2026?
For roles experiencing significant wage inflation AI engineering, DevOps, cybersecurity, cloud security annual reviews are no longer sufficient. The market is moving fast enough that a comp band set in January can be meaningfully out of step with live market conditions by Q3. A quarterly review cadence for high-surge role categories, informed by live job posting data rather than annual survey results, is a more defensible approach for 2026. For the rest of your workforce where market movement is more gradual, a semi-annual or annual cadence remains reasonable the key is separating the two groups rather than applying the same review frequency across the board.
3. What is the difference between a salary forecast and a salary benchmark, and why does it matter?
A salary benchmark tells you what roles are paying right now based on available data. A salary forecast uses leading indicators job posting volume growth, skills premium trends, geographic expansion signals to project where compensation is heading over the next two to three quarters. Both are useful, but they serve different purposes. Benchmarks inform your current offer decisions. Forecasts inform your comp band planning, your headcount budget, and your talent acquisition strategy before you are already in a competitive process. Using only benchmarks is reactive. Adding a forecast layer makes your compensation strategy proactive which is the difference between setting bands that are competitive when you open a role and scrambling to get approval for an exception offer when you find a candidate you actually want to hire.
4. How do secondary tech markets like Austin and Raleigh affect remote compensation strategy?
Secondary markets complicate the location-based pay adjustment model that most enterprises built their remote comp strategy around. The assumption underlying those adjustments that hiring in Austin or Raleigh gives you a meaningful cost advantage over coastal hiring is eroding as those markets become more competitive in their own right. Austin now ranks as the top city in the US for salary-adjusted tech compensation, and Raleigh is seeing 59% job growth alongside nearly 9% wage growth year-over-year. If your remote pay bands were calibrated against those markets two or three years ago and have not been updated with live posting data since, they are almost certainly behind what local employers are now offering which means your location-based discount may be costing you candidates rather than saving you money.
5. What is predictive analytics in the context of compensation planning, and how does job posting data enable it?
Predictive analytics in compensation planning means using leading indicators to anticipate where salary pressure is building before it shows up in your offer decline rates or exit interview data. Job posting data enables this because posting volume trends for a role or geography are a reliable leading indicator of compensation movement demand growth in postings tends to precede salary range growth by one to two quarters. When you track posting velocity for your key roles in your key markets on a real-time basis, you can see the early signal of an upcoming wage surge before it becomes a retention problem or a lost hire. That is the practical definition of forward-looking pay planning and it is only possible with data that is current enough to reflect what is happening in the market right now rather than what happened during last year’s survey window.