- The Compensation Intelligence Report 2026: What Every HR Leader Needs to Know Before Setting Pay Strategy This Year
- Why Compensation Intelligence Is the Competitive Edge Most Companies Are Still Sleeping On
- Live Salary Benchmarking Built for Enterprise Teams
- What Is Compensation Intelligence and Why It's Not the Same as Running a Salary Report
- Key Finding #1 Pay Transparency Is No Longer Optional: What the 2026 Data Is Telling Us
- See Compensation Intelligence in Action
- Key Finding #2 The Salary Index 2026: Where Pay Is Rising, Stalling, and Shifting
- Key Finding #3 AI Is Creating a Skills Premium That Goes Well Beyond Tech Roles
- Key Finding #4 Pay Equity Gaps Are Widening Even as Transparency Rules Tighten
- See Compensation Intelligence in Action
- How JobsPikr's Compensation Intelligence Platform Turns Job Posting Data Into Pay Strategy
- What the Compensation Intelligence Report 2026 Means for CHROs, CFOs, and Total Rewards Leaders
- The Companies Getting Compensation Intelligence Right Have One Thing in Common
- See Compensation Intelligence in Action
- Frequently Asked Questions
The Compensation Intelligence Report 2026: What Every HR Leader Needs to Know Before Setting Pay Strategy This Year
Pay strategy built on last year’s data is already losing you, candidates. The Compensation Intelligence Report 2026 draws on insights from JobsPikr’s database of over 100 million live job postings to show where compensation is moving, why it’s moving, and what that means for companies trying to stay competitive on pay.
Here is what the data tells us:
- Pay transparency is accelerating faster than most companies are ready for. More than 68% of job postings included salary ranges in 2025, up from 45% in 2023. Legislation is expanding globally, and companies that are not building pay transparency data into their comp workflows are already behind.
- The salary index for 2026 shows meaningful divergence by region, role, and industry. Global salary trends are not moving in a straight line. Some markets are heating up sharply while others are plateauing, and applying a single benchmark across geographies is one of the most common and costly mistakes comp teams make.
- AI skills are commanding a premium that goes well beyond tech roles. Workers with AI-relevant skills earned an average 56% wage premium in 2024, up from 25% the year before, according to PwC’s 2025 Global AI Jobs Barometer. That gap is showing up in finance, healthcare, operations, and functions that never used to think of themselves as competing for technical talent.
- Pay equity gaps are not closing on their own. Even as transparency rules tighten across the US and Europe, the data shows that disclosed salary ranges and actual pay equity are two very different things. Compliance and fairness are not the same metric.
- Live job posting data is outperforming annual surveys as a benchmarking source. The structural lag in traditional compensation surveys, often 12 to 18 months from data collection to application, is no longer acceptable in a market that moves this fast.
Compensation intelligence is no longer a reporting function. It is a strategic one. The organizations treating it that way are hiring faster, retaining better, and making pay decisions they can defend.
Why Compensation Intelligence Is the Competitive Edge Most Companies Are Still Sleeping On
There is a version of compensation strategy that most large organizations are still running. It goes something like this: pull last year’s salary survey, apply a cost-of-living adjustment, add a small buffer for “market competitiveness,” and sign off on the comp bands. It is a process that feels rigorous because it has steps. But in 2026, it is about as useful as navigating with a map that was printed two years ago.
The labor market has not been kind to that approach. According to the U.S. Bureau of Labor Statistics, employment costs for civilian workers rose 3.8% over the 12 months ending in December 2024, but that headline number masks enormous variation by role, industry, and geography. Applying a single percentage adjustment across your entire comp structure, which is exactly what most survey-based processes do, means you are simultaneously overpaying in some pockets and losing candidates in others without a clean line of sight into either problem.
Pay transparency legislation is reshaping what companies are required to disclose publicly. AI-driven skills premiums are inflating compensation expectations in roles that did not use to compete for technical talent. And according to PwC’s 2025 Global AI Jobs Barometer, which analyzed close to one billion job ads across six continents, AI-skilled workers earned an average 56% wage premium in 2024, nearly double the 25% premium recorded the year before. That kind of movement does not show up cleanly in an annual survey. By the time the survey is published, the market has already repriced.
The gap between what a well-benchmarked offer looks like and what an outdated one looks like has never been wider or more visible to the candidates sitting across the table from you. Research from the Josh Bersin Company found that organizations using real-time labor market data in their compensation decisions report significantly stronger offer acceptance rates and lower regrettable attrition compared to those relying on annual survey cycles alone. The data infrastructure behind your pay decisions is no longer a back-office concern. It is a hiring outcome.
This is where compensation intelligence comes in. Not as a rebranded version of the same annual survey process, but as something genuinely different: a real-time, data-driven approach to understanding what the market is paying, why it is paying that, and what your organization needs to do to stay competitive, equitable, and compliant all at once.
This report is built on data from JobsPikr’s database of over 100 million live job postings, tracked and normalized in real time across geographies, industries, role types, and seniority levels. That means what you are reading is not a snapshot from last spring. It reflects what companies are actively advertising today, which is the most direct signal of hiring intent and compensation reality available anywhere.
The findings in this report are aimed squarely at the people who carry the weight of these decisions: CHROs building pay frameworks for organizations that span multiple countries, CFOs trying to understand what the talent cost structure looks like for the next 18 months, Total Rewards leaders holding together comp bands that the market keeps pushing against, and HR tech leaders who know their current benchmarking tools are not keeping pace.
What follows is not a collection of feel-good industry averages. It is a set of findings, grounded in real posting data and verified external research, that are meant to change how you think about pay strategy heading into the rest of 2026. Some of it will confirm things you already suspected. Some of it will surprise you. All of it is actionable.
Live Salary Benchmarking Built for Enterprise Teams
Role-specific, geography-specific, and updated in real time from 100M+ job postings. No surveys. No lag.
What Is Compensation Intelligence and Why It’s Not the Same as Running a Salary Report
Most compensation teams are drowning in data but starving for insight. They have access to survey outputs, internal HRIS exports, the occasional benchmarking tool, and a spreadsheet that someone built three years ago and nobody wants to touch. What they often do not have is a coherent, current picture of what the external market looks like for the specific roles they are trying to fill or retain right now.
That distinction, between having data and having intelligence, is exactly what the term compensation intelligence is meant to capture.
The Actual Definition: What Compensation Intelligence Means in Practice
At its core, compensation intelligence is the practice of combining real-time external market data with internal pay information to make smarter, faster, and more defensible decisions about how your organization pays people. It goes beyond pulling a median salary figure for a job title. It includes understanding how pay is shifting over time, where your internal ranges sit relative to the live market, which roles carry skills premiums that your current bands do not account for, and whether your compensation structure holds up under a pay equity lens. It is, in short, the difference between knowing a number and understanding a market.
Why Pay Transparency Data Has Raised the Stakes for Getting This Right
This matters more in 2026 than it ever has before, and the pay transparency wave is a big part of why. According to Brightmine’s 2025 Pay Transparency Survey, 45% of U.S. employers now operate in jurisdictions with active pay transparency laws, and that number is climbing as more states and municipalities pass salary disclosure requirements. When companies are required to post salary ranges publicly, the information that used to sit behind closed survey doors becomes visible to everyone, including your candidates, your existing employees, and your competitors. That shift has fundamentally changed what candidates expect to know before they even apply, and it has raised the stakes for getting your compensation ranges right the first time.
If your posted range is out of step with what the live market shows for the same role, candidates will notice. And in an environment where pay transparency data is increasingly searchable and comparable, the cost of a poorly calibrated range is not just one declined offer. It is a signal that travels.
How Talent Intelligence Has Evolved Into a Core Strategic Function
A few years ago, workforce intelligence was mostly about headcount planning and sourcing pipelines. Today, the most sophisticated HR organizations are using talent intelligence platforms to understand not just who is available in the market, but what those people expect to be paid, what skills they carry, and how compensation expectations differ across geographies and industries. According to Deloitte’s 2024 Global Human Capital Trends report, organizations that embed workforce intelligence into their core HR processes are significantly more likely to report strong business outcomes tied to talent, including retention, productivity, and time-to-hire. Compensation intelligence is a core layer of that broader capability, not a separate function sitting off to the side.
The Structural Flaw in Traditional Salary Benchmarking
The old benchmarking model has a problem that is getting harder to ignore. Traditional salary surveys operate on an annual or semi-annual cycle. Data is collected, cleaned, validated, and published on a timeline that typically means the numbers you are applying today reflect market conditions from 12 to 18 months ago. In a stable labor market, that lag is inconvenient. In a market where skills premiums are shifting quarter to quarter and pay transparency legislation is forcing rapid repricing across entire industries, that lag is genuinely costly. According to SHRM, HR leaders cite outdated compensation data as one of the top three factors contributing to failed offers and extended time-to-fill for specialized roles.
There is also a participation problem that rarely gets discussed openly. Salary surveys rely on manual submissions from a self-selected group of employers, which means the resulting benchmarks often skew toward larger, more established organizations. If your actual competitive set includes high-growth companies, AI-native firms, or industry disruptors, the survey data you are using may not reflect what those organizations are paying at all.
What Compensation Intelligence Does Differently
What compensation intelligence does differently is replace that lagging snapshot with a living picture. Instead of asking “what did companies pay for this role last year,” it asks “what are companies actively offering for this role right now, in this market, at this seniority level.” That shift in question produces a fundamentally more useful answer, and it is the foundation on which every finding in this report is built.
For JobsPikr, this is what the platform is built to deliver. By tracking and structuring over 100 million live job postings in real time, normalizing role titles, salary ranges, geographic data, and skills requirements into a queryable format, the platform gives compensation and total rewards teams the kind of current, specific, and comparable data that annual surveys simply cannot produce on the same timeline. The result is compensation intelligence that reflects the market as it is, not as it was when someone last ran a survey intake.
The sections that follow break down exactly what that intelligence reveals when you apply it to the biggest compensation questions facing HR leaders in 2026.
Key Finding #1 Pay Transparency Is No Longer Optional: What the 2026 Data Is Telling Us
If there is one thing that has fundamentally changed the compensation conversation over the last two years, it is pay transparency. Not the idea of it, which has been floating around HR circles for a while, but the legal reality of it. Salary disclosure is no longer a progressive employer branding choice. In a growing number of markets, it is the law.
The Pay Transparency Legislation Landscape in 2026
The regulatory picture has moved quickly. In the United States, states including California, New York, Colorado, Washington, and Illinois have all passed pay transparency laws requiring employers to include salary ranges in job postings. According to the National Conference of State Legislatures, the number of states with active pay transparency legislation has more than doubled since 2022.
The impact on job postings has been measurable. More than 68% of job postings in 2025 included salary ranges, up from just 45% in 2023, based on data tracked through JobsPikr’s posting database. Globally, the EU Pay Transparency Directive requires member states to transpose it into national law by June 2026, covering salary disclosure, gender pay gap reporting, and employee rights to request pay comparison data. For multinationals, this is not a minor compliance update. It is a structural change in how pay information is shared across entire regions.
The Gap Between Disclosed Ranges and Actual Pay Equity
Here is the part most organizations are getting wrong. Posting a salary range and achieving pay equity are not the same thing. A company can publish a range of $90,000 to $140,000 for a role and still have meaningful disparities within that band based on gender, tenure, or role history, none of which are visible from the posting alone. According to the World Economic Forum’s Global Gender Gap Report 2024, women globally earn approximately 84 cents for every dollar earned by men in equivalent roles, and that gap is closing far too slowly to be solved by disclosure alone.
For Total Rewards leaders, pay transparency compliance and pay equity analytics need to be treated as two separate workstreams that inform each other. You can be fully compliant in every market you operate in and still have a pay equity problem that is completely invisible to the outside world but very visible to your employees.
What This Means for Your Compensation Strategy
The organizations handling this well in 2026 have mapped their current compensation ranges against live market data, built a regular cadence of pay equity analysis into their comp review cycle, and started treating pay transparency data as a strategic benchmarking input, not just a regulatory output. That shift in mindset is what separates companies that are ahead of this from those that are still catching up.
See Compensation Intelligence in Action
Get a live walkthrough of how JobsPikr’s salary benchmarking platform works for your roles, markets, and industries.
Key Finding #2 The Salary Index 2026: Where Pay Is Rising, Stalling, and Shifting
Not all salaries are moving in the same direction in 2026, and that is exactly the point. If you are managing compensation across multiple functions, the story your benchmark data needs to tell is not a single headline number. It is a picture of divergence, and the divergence right now is significant.
JobsPikr’s job posting data across eight roles and five industries tells that story clearly.
Role-by-Role: Winners, Plateaus, and Corrections
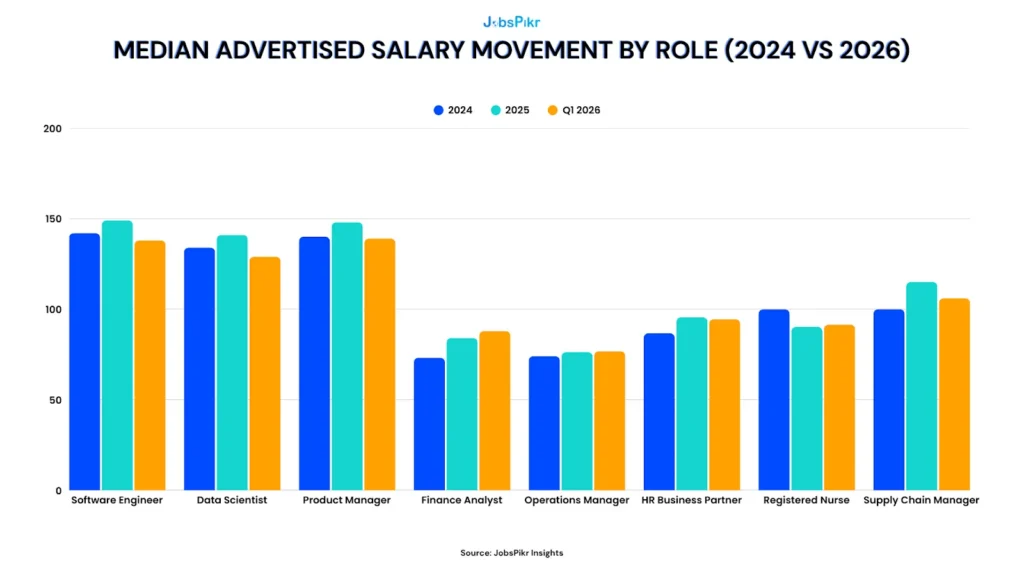
The data above covers eight roles spanning technology, finance, healthcare, and operations, and the patterns are worth reading carefully.
Finance Analyst stands out as the clearest growth story across the three-year window, moving from $73.2K in 2024 to $87.9K in Q1 2026, a gain of nearly 20%. That kind of movement in a traditionally stable function reflects how much financial services has been investing in analytical capability, particularly roles that sit at the intersection of finance and data. Operations Manager has been the most stable, barely moving across all three periods, which suggests the market for that function has found a relatively settled equilibrium.
The more interesting story is what is happening to tech-adjacent roles. Software Engineer, Data Scientist, and Product Manager all peaked in 2025 and have pulled back in Q1 2026. Software Engineers dropped from $149K in 2025 to $138K. Data Scientists went from $141K to $129K. Product Managers from $148K to $139K. This is not a market collapse. It is a market correcting after a period of aggressive hiring that has now moderated. For comp teams, the implication is important: the 2025 peak should not be the anchor for your current bands in these roles. The market has moved.
HR Business Partner followed a similar arc, rising strongly to $95.5K in 2025 before easing slightly to $94.5K in Q1 2026. Supply Chain Manager showed the sharpest single-year jump, from $100K to $115K in 2025, before pulling back to $106K. Registered Nurse is the most unusual pattern in the dataset, dropping from $99.9K in 2024 to $90.2K in 2025 before a slight recovery to $91.5K, which likely reflects a post-pandemic normalization in healthcare staffing markets after the surge premium period wound down.
Industry-Level: The Advertised Salary Picture Is More Complicated Than It Looks
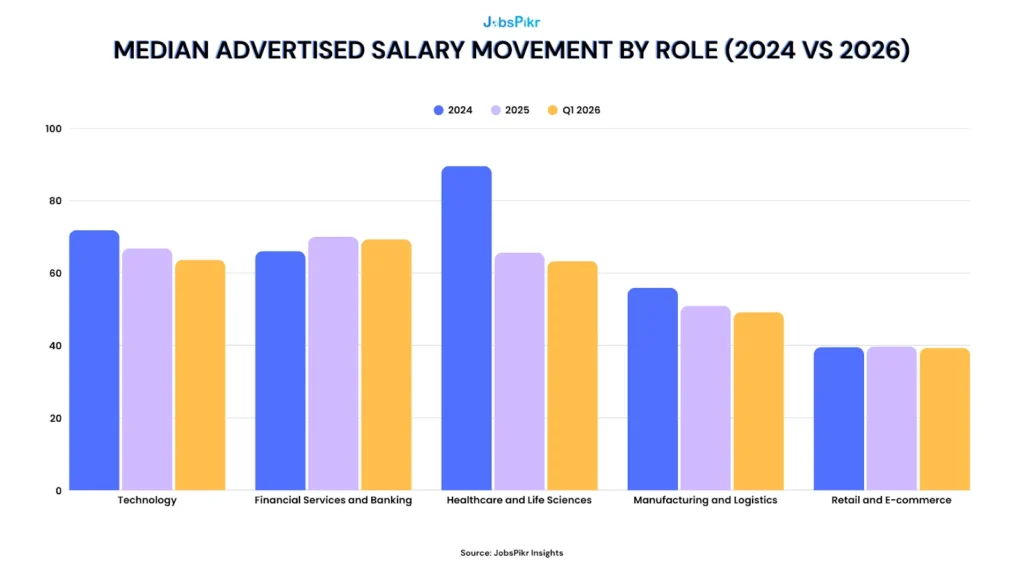
At the industry level, the data reveals something that runs counter to the conventional narrative: several industries widely associated with strong compensation are actually showing declining advertised salary ranges, not rising ones.
Technology has moved from $71.8K in 2024 down to $63.6K in Q1 2026. Healthcare and Life Sciences has dropped from $89.5K to $63.3K over the same period. Manufacturing and Logistics has declined from $55.9K to $49.2K. These are not rounding errors. They reflect a genuine shift in what employers are advertising for broad cross-sections of roles in these sectors.
Financial Services and Banking is the one industry bucking that trend, rising from $66K in 2024 to $70K in 2025 before a slight dip to $69.3K in Q1 2026, still comfortably above where it started. Retail and E-commerce has remained essentially flat across all three periods, moving within a $0.4K range the entire time.
The practical implication for compensation strategy is this: if you are setting or refreshing salary bands based on industry-level benchmarks from 2025, you may be working from numbers that no longer reflect what the market is advertising. The correction is real, and it is concentrated in the sectors that saw the most aggressive run-up in posting volumes during 2023 and 2024.
Key Finding #3 AI Is Creating a Skills Premium That Goes Well Beyond Tech Roles
There is a number that keeps appearing in every credible piece of labor market research right now, and it is worth sitting with before we get into the specifics. According to PwC’s 2025 Global AI Jobs Barometer, which analyzed close to one billion job ads across six continents, workers with AI skills earned an average 56% wage premium in 2024, up from 25% the year before. That doubling in a single year is not a rounding error in the data. It is a signal that the market is repricing AI capability faster than most compensation teams are adjusting for.
What makes this directly relevant to compensation intelligence strategy is not just the size of the premium. It is where it is showing up.
The AI Skills Premium Is No Longer Confined to Engineering
The assumption most comp teams are still operating under is that AI skills premiums are a tech talent problem. They are not. According to McKinsey’s 2025 State of AI report, three-quarters of AI skill demand is currently concentrated across computer and mathematical roles, management, and business and financial operations, meaning the premium has already spread well beyond engineering teams. LinkedIn’s 2025 Work Change Report flagged AI tool proficiency as the fastest-growing skill globally, and since ChatGPT launched in late 2022, job postings mentioning generative AI skills grew 800% for non-tech roles.
For Total Rewards leaders, this creates a specific and underappreciated problem. If your salary bands for a Finance Analyst or an HR Business Partner were built without factoring in the AI skills premium, you may be offering the same range for two candidates whose market value differs significantly. The person who brings AI-driven forecasting capability or people analytics proficiency is not the same hire as the one who does not, and the market has already priced that difference in.
According to PwC’s 2025 Global AI Jobs Barometer, wages are growing twice as fast in industries more exposed to AI compared to less exposed industries, and that premium applies in every single industry analyzed, not just technology. That is the part most compensation benchmarks are still missing.
The Skills Commanding the Highest Premiums in 2026
Not all AI skills carry the same market weight, and the hierarchy matters for how you structure comp bands. According to Rise’s AI Talent Salary Report 2026, specialized AI skills add 25 to 45% premiums on top of base compensation, with LLM fine-tuning and MLOps at scale sitting at the top of that range. Acceler8 Talent’s Q1 2026 market analysis found that the premium widens sharply with seniority, sitting at around 6% at entry level but exceeding 70% at senior levels in organizations competing for specialist talent.
The skills worth tracking most closely in 2026 job postings are LLM engineering and fine-tuning, RAG pipeline development, MLOps at scale, AI governance and responsible AI, and generative AI tool proficiency in non-technical business roles. According to Autodesk’s AI Jobs Report cited by industry analysts, demand for prompt engineering roles alone grew 135.8% in 2025, which tells you something important about how fast the non-technical end of the AI skills spectrum is being priced into the market.
The broader implication is straightforward: a compensation intelligence strategy that does not account for skills-level differentiation within job titles is leaving a significant blind spot in your benchmarking. The title says Finance Analyst. The salary says something quite different depending on what is in the requirements section.
Key Finding #4 Pay Equity Gaps Are Widening Even as Transparency Rules Tighten
This is the finding that tends to make people most uncomfortable, and it is worth addressing directly. Despite years of DEI commitments, expanding pay transparency legislation, and a growing body of pay equity tooling in the HR tech market, the gap between what men and women earn for equivalent work is not closing at any meaningful pace. In some markets and sectors, it is getting wider.
The data from 2.3 million+ job postings analyzed through JobsPikr’s database makes this visible in a way that annual surveys simply cannot.
The Global Picture: Progress That Is Far Too Slow
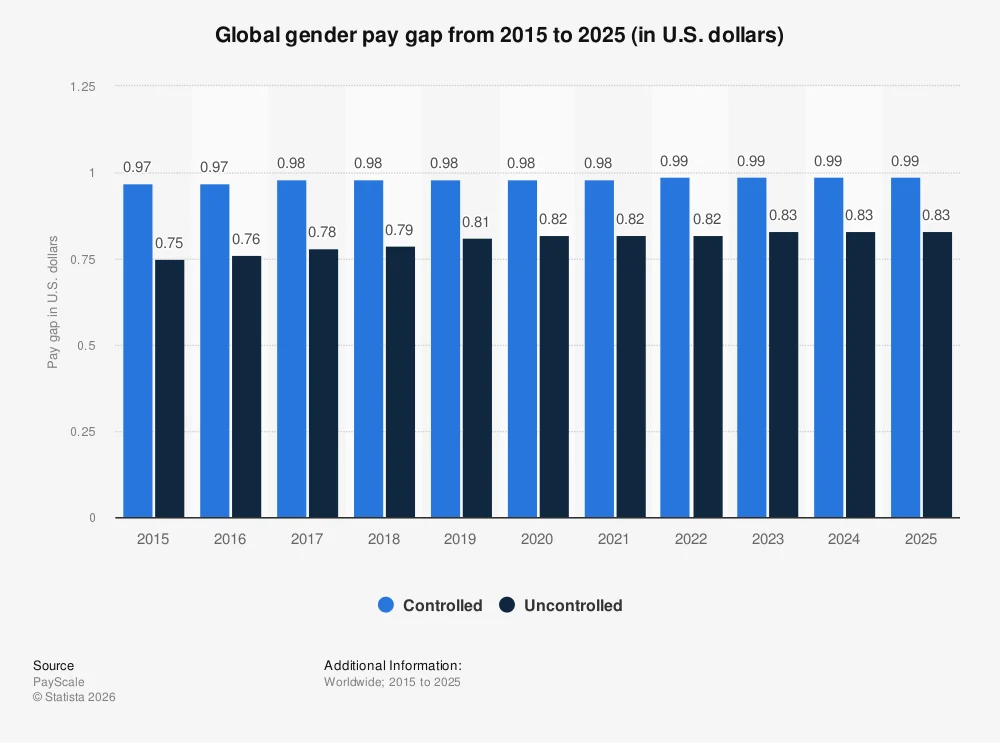
Image Source: Statista
According to the World Economic Forum’s Global Gender Gap Report 2025, the world is an estimated 123 years away from full economic parity between men and women at the current rate of progress. Women in the United States earned 83.6% of what men earned in 2024, a figure that narrows to 95 cents on the dollar for younger workers aged 25 to 34, but widens sharply again as women move into mid and senior career stages.
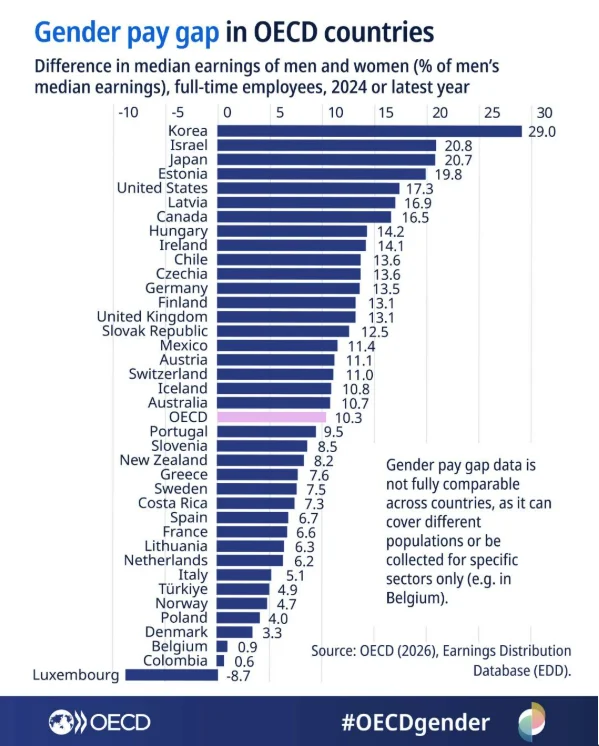
Image Source: OECD
The regional picture, drawn from OECD data, shows that the gap is not uniform. Nordic countries remain the closest to parity globally, with Iceland the only economy to have closed more than 90% of its gender gap. The EU average sits at around 13%, but that figure masks significant variation between member states. Eastern and Southern Europe continue to show wider gaps, while Asia-Pacific is the slowest-moving region of all, having closed only 3.3 percentage points of its gender gap since 2006.
Where the Gap Is Worst: Industry-Level Reality
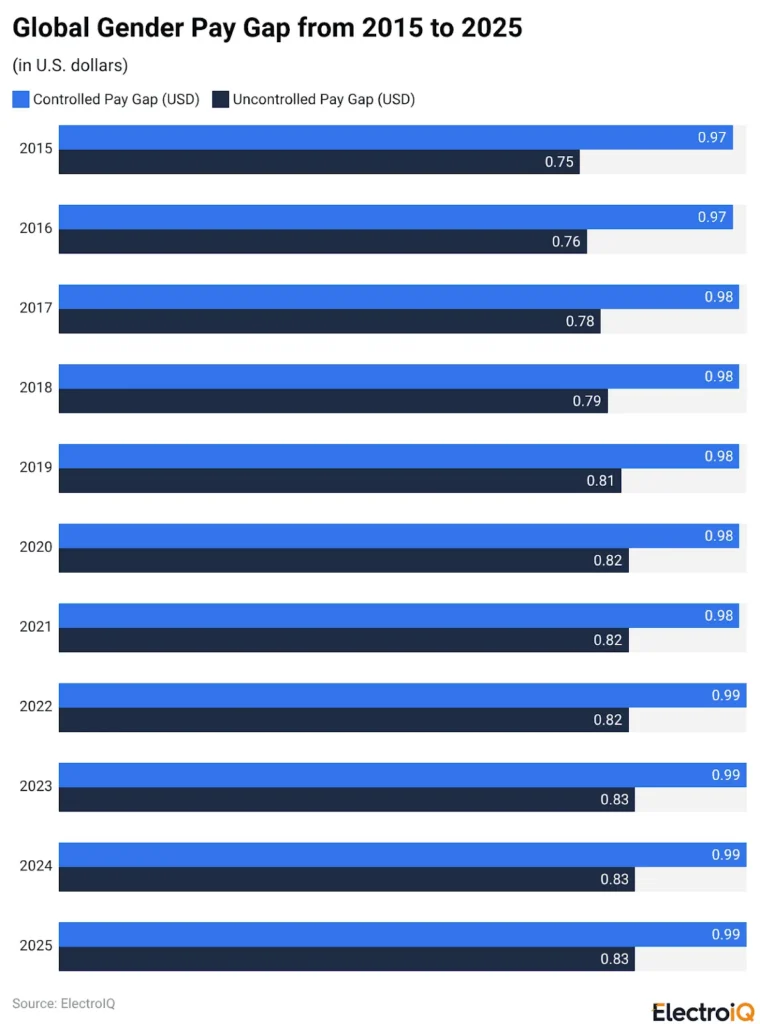
Image Source: Electroiq
Finance and insurance is consistently the worst-performing sector for pay equity, and the numbers are not subtle. According to US Census Bureau data cited by the World Economic Forum, women in the US finance and insurance industry earn just 63 cents for every dollar earned by their male counterparts, despite making up more than half of that sector’s workforce. Technology and professional services show women earning around 73 cents on the dollar on average, compounded by very low female representation in senior technical roles.
The pattern across industries points to something structural. The sectors where women are most numerically dominant are not the same as the sectors where women are paid most equitably. Healthcare, education, and care work employ large female majorities but consistently offer lower average wages relative to their complexity, which is itself a form of pay inequity that posted salary ranges make visible at scale.
The Seniority Problem Nobody Wants to Talk About
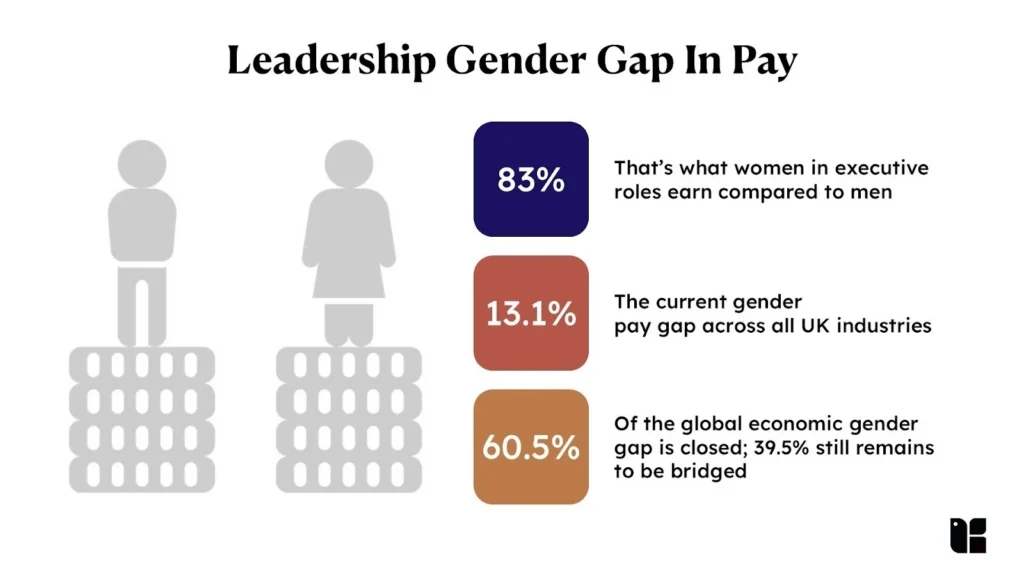
Image Source: Kapable
The gender pay gap does not stay flat throughout a career. It compounds. According to McKinsey and LeanIn.Org’s Women in the Workplace 2024 report, for every 100 men promoted to their first management role, only 81 women are promoted. That broken rung in the corporate ladder creates a pipeline imbalance that widens at every subsequent level. By the time you reach director and executive roles, McKinsey and LeanIn.Org’s 2025 report found that women make up just 29% of C-suite positions despite representing 49% of entry-level employees.
For compensation teams, this means a pay equity audit that only looks at whether women and men in the same role are paid the same is missing most of the problem. The gap is not just within levels. It is in who reaches each level at all, and what the posted salary ranges look like for the leadership roles that remain male-dominated.
What Compensation Intelligence Does That Audits Cannot
This is where compensation intelligence has a genuine structural advantage over traditional pay equity audits. An internal audit can tell you how your organization compares to itself. It cannot tell you whether your salary ranges for a given role are equitable relative to what the live market is offering for equivalent roles in your sector and geography right now.
Job posting data at scale surfaces patterns that self-reported survey data and internal HR reports consistently miss: which sectors are posting lower salary ranges for female-dominated roles, which geographies show the widest spread between comparable titles, and which seniority levels show the sharpest divergence as you move up the ladder. According to Payscale’s 2025 Compensation Best Practices Report, while pay equity analysis has grown as a priority by 19% since 2020, investment in it has actually declined 5% since 2024. The commitment is there in principle. The follow-through is lagging, and the data infrastructure to support it is often the missing piece.
See Compensation Intelligence in Action
Get a live walkthrough of how JobsPikr’s salary benchmarking platform works for your roles, markets, and industries.
How JobsPikr’s Compensation Intelligence Platform Turns Job Posting Data Into Pay Strategy
Every finding in this report comes back to the same underlying question: how do you make compensation decisions that reflect the market as it actually is right now, not as it was when someone last ran a survey? That is the problem JobsPikr is built to solve, and it is worth being specific about how it works in practice, because the mechanics matter.
The Data Foundation: 100M+ Live Job Postings, Normalized in Real Time
JobsPikr tracks and structures job postings from across the web in real time, pulling from over 100 million postings across geographies, industries, role types, and seniority levels. The platform normalizes that raw data, standardizing job titles, salary ranges, location information, and skills requirements into a consistent, queryable format that compensation teams can actually use without spending three days cleaning a spreadsheet first.
What that means in practice is that when a Total Rewards leader wants to know what Software Engineers are being offered in Austin right now, at the mid-level, in financial services, the answer is in the data today, not in a report that was published six months ago based on data collected six months before that. That 12 to 18-month lag is exactly what JobsPikr eliminates, and in a market where advertised salaries for the same role can shift by 10% or more in a single year, as the data in this report shows, that lag is not a minor inconvenience. It is a strategic liability.
What Compensation Teams Can Actually Do With It
The platform is built around three core use cases that matter most to CHROs, Total Rewards leaders, and CFOs planning headcount budgets.
The first is salary benchmarking by role, location, and seniority. Rather than pulling a single median figure for a job title, JobsPikr gives you the distribution, showing the floor, the ceiling, the 25th and 75th percentiles, and how those numbers shift across cities, industries, and experience levels. That is the difference between knowing a market exists around $140K and knowing that in your specific hiring market, the range runs $118K to $165K, that the 75th percentile is $152K, and that offers below $130K have been declining at a measurable rate over the last two quarters.
The second is pay equity analysis using external market data rather than internal benchmarks alone. As Key Finding #4 made clear, an internal audit can only tell you how your organization compares to itself. JobsPikr lets you layer live market data on top of that internal picture, so you can see whether your salary ranges for female-dominated roles or specific geographies are out of step with what the broader market is offering for equivalent positions.
The third is workforce intelligence for headcount planning and budgeting. By tracking posting volume, skills demand, and salary movement in real time, the platform gives finance and HR leaders a forward-looking view of where talent costs are heading, not just where they have been. That kind of signal is increasingly essential for CFOs trying to model labor cost scenarios for the next 12 to 18 months without relying entirely on vendor forecasts or analyst reports.
See It in Action
The demo below walks through exactly how JobsPikr’s salary benchmarking works in practice, from pulling role-specific data to comparing across geographies and seniority levels.
Why Live Posting Data Outperforms Survey-Based Benchmarking
It is worth being direct about one more thing. The advantage of pulling compensation data from live job postings is not just freshness, though that matters enormously. It is signal quality. When a company posts a role with a salary range attached, that number reflects a real budget decision made by someone with a hiring deadline. It is not self-reported through a survey template. It is not averaged across companies of wildly different sizes, stages, and structures. It is what that employer, in that city, for that specific role, is willing to pay right now.
According to SHRM, HR leaders increasingly cite outdated compensation data as one of the top factors contributing to failed offers and extended time-to-fill for specialized roles. The organizations moving away from annual survey dependence and toward live posting data are the ones whose offers land, whose comp bands hold, and whose pay equity analyses reflect the market rather than last year’s best guess at it.
That is what compensation intelligence looks like when it is working properly. And that is what JobsPikr is built to deliver.
What the Compensation Intelligence Report 2026 Means for CHROs, CFOs, and Total Rewards Leaders
Data without a clear line to action is just noise. The findings in this report are only useful if they connect to the decisions you are actually making this quarter, whether that is refreshing comp bands, building a headcount budget, defending an offer to a hiring manager, or making the case to your board that your pay equity program has teeth. This section is about that connection.
For CHROs: Your Comp Bands Need a Shorter Refresh Cycle
The single most actionable takeaway from the salary index data in this report is that the assumption of an 18-month comp band lifecycle is no longer safe, particularly for roles sitting at the intersection of technology and business function. Software Engineers, Data Scientists, and Product Managers all peaked in 2025 and have already pulled back meaningfully in Q1 2026. Finance Analysts moved nearly 20% over two years. If your band reviews are happening annually, you are almost certainly either overpaying in some pockets or losing candidates in others, and in both cases without a clear data signal telling you why.
The practical fix is not a complete overhaul of your comp architecture. It is building in a quarterly market check for your highest-volume and highest-variance roles using live posting data, and treating the result as an input to your offer approval workflow rather than a reference document that sits in a folder. According to Deloitte’s 2024 Global Human Capital Trends report, organizations that embed workforce intelligence into core HR processes are significantly more likely to report strong outcomes across retention, time-to-hire, and offer acceptance. The data infrastructure behind your pay decisions is the differentiator, not the decisions themselves.
For CFOs: Labor Cost Forecasting Requires Live Market Signals
The industry-level salary data in this report tells a story that matters directly to financial planning. Technology, Healthcare and Life Sciences, and Manufacturing and Logistics all showed declining advertised salary ranges from 2024 through Q1 2026, while Financial Services held relatively stable. If your labor cost model for the next fiscal year was built on 2025 industry benchmarks, you may be carrying cost assumptions that no longer reflect what the market is advertising.
This is not an argument for optimism about labor costs across the board. It is an argument for precision. The divergence between roles that are still rising, Finance Analyst up nearly 20% over two years, and roles that have corrected, Software Engineer down roughly 7% from peak, means that a single inflation assumption applied across your entire headcount plan will be wrong in both directions simultaneously. According to the U.S. Bureau of Labor Statistics, employment costs for civilian workers rose 3.8% over the 12 months ending December 2024, but that headline number masks the variance that matters for role-level budgeting. Live posting data gives you the role-level signal that aggregate indices cannot.
For Total Rewards Leaders: The Pay Equity Gap Is a Compensation Intelligence Problem
The pay equity findings in this report are not a DEI issue that sits separately from your compensation strategy. They are a compensation intelligence problem. The gap between disclosed salary ranges and actual pay equity, the seniority compounding effect, the sector-level disparities in how female-dominated roles are valued, all of these are visible in live job posting data in ways that internal audits and annual surveys consistently miss.
Payscale’s 2025 Compensation Best Practices Report found that 31% of organizations identify unfair pay as the primary reason for losing talent. That is not a number that sits quietly in an exit survey. It shows up in attrition rates, in glassdoor reviews, and eventually in the difficulty of filling roles in the same function the following year. The organizations treating pay equity analysis as a live, ongoing function rather than an annual compliance exercise are the ones catching those gaps before they become retention problems.
The Warning Signs Your Compensation Data Is Already Stale
Three signals tend to show up before your ATS data makes the problem obvious. The first is offer decline rates creeping up without clear candidate feedback explaining why. The second is time-to-fill stretching for specific roles even when sourcing volume has not changed, which usually means candidates are running parallel processes and accepting faster elsewhere. The third is when your own team starts talking about what their networks are being offered. If those conversations are happening, your benchmarks need refreshing before the next headcount review, not after.
The companies that consistently hire and retain well treat compensation intelligence as a live function, not a report they pull from a vendor once a year. That shift is simpler than it sounds and the data in this report shows exactly what it reveals when you make it.
The Companies Getting Compensation Intelligence Right Have One Thing in Common
The findings in this report point in one clear direction. The organizations that are hiring competitively, retaining their best people, and building pay structures that hold up under scrutiny are not the ones with the most sophisticated comp philosophy. They are the ones with the most current data.
That sounds simple. It is harder to execute than most comp teams will admit, because the default infrastructure for compensation benchmarking, annual surveys, self-reported data, and lagging industry reports was not built for a market that moves the way this one does. A salary index that shows Finance Analysts rising nearly 20% over two years while Software Engineers correct 7% from peak is not a market you can navigate with a single annual refresh. It requires live signals, role-level granularity, and a benchmarking workflow that treats compensation as an ongoing function rather than a planning season exercise.
The pay transparency wave is accelerating that need, not reducing it. As more employers are required by law to post salary ranges, the quality and coverage of live posting data improve. The benchmark gets better as transparency increases, which means organizations already structured to capture and act on that data have a compounding advantage over those still waiting for the annual survey cycle to catch up.
The AI skills premium finding adds another layer of urgency. When the same job title commands materially different market rates depending on what skills are listed in the requirements, a comp band built on title alone is not a comp band. It is a rough guess. And in a market where that gap is measurable in tens of thousands of dollars for non-engineering roles, rough guesses have a real cost.
Pay equity sits underneath all of this. The gap between what pay transparency legislation requires and what genuine pay equity looks like is significant, and it is not closing on its own. The organizations making real progress are the ones treating equity analysis as a data problem, not a reporting obligation, using live market benchmarks to surface where their ranges are structurally out of step before those gaps show up as attrition.
Compensation intelligence is not a new category. But what it means in 2026, real-time, role-specific, skills-aware, equity-informed, is substantively different from what most organizations currently have. JobsPikr is built for that gap. With over 100 million live job postings tracked and normalized in real time, it gives the HR leaders, Total Rewards teams, and CFOs who carry the weight of these decisions the signal they need to make them well.
See Compensation Intelligence in Action
Get a live walkthrough of how JobsPikr’s salary benchmarking platform works for your roles, markets, and industries.
Frequently Asked Questions
1. What is compensation intelligence and how is it different from salary benchmarking?
Salary benchmarking is a component of compensation intelligence, but it is not the whole picture. Compensation intelligence is the broader practice of combining real-time external market data with internal pay information to make smarter decisions about how your organization structures, sets, and adjusts pay. Where a salary benchmark gives you a median figure for a job title, compensation intelligence gives you the distribution across seniority levels, geographies, and industries, how that distribution is shifting over time, where your internal ranges sit relative to the live market, and whether your compensation structure holds up under a pay equity lens. The distinction matters because in a market where advertised salaries for the same role can move 10% or more in a single year, a single benchmark number is not enough to make a defensible comp decision.
2. How does pay transparency data improve compensation benchmarking?
When companies are legally required to post salary ranges in job listings, those ranges become structured, publicly available data points that reflect real hiring intent rather than survey responses. According to data tracked through JobsPikr’s posting database, more than 68% of job postings included salary ranges in 2025, up from 45% in 2023. That increase in disclosed data directly improves the quality and coverage of live benchmarking sources, because every posted range is a verifiable signal of what an employer is willing to pay in current market conditions. As the EU Pay Transparency Directive is transposed into national law across member states through 2026, the volume and reliability of that data will continue to improve, making live posting data an increasingly powerful benchmarking source relative to traditional surveys.
3. What does the salary index 2026 show about where compensation is heading?
The JobsPikr salary index data for 2026 shows a market that is diverging, not moving uniformly in one direction. Finance Analyst roles rose nearly 20% from 2024 to Q1 2026, while Software Engineer, Data Scientist, and Product Manager roles peaked in 2025 and have pulled back meaningfully in Q1 2026, reflecting a correction after a period of aggressive hiring. At the industry level, Technology, Healthcare and Life Sciences, and Manufacturing and Logistics all showed declining advertised salary ranges from 2024 through Q1 2026, while Financial Services held relatively stable. The practical implication is that a single salary index number or inflation assumption applied across an entire headcount plan will be wrong in multiple directions simultaneously. Role-level and industry-level granularity, refreshed from live data, is what makes the difference between a comp strategy that holds and one that is perpetually playing catch-up.
4. How is the AI skills premium affecting compensation strategy for non-tech roles?
The AI skills premium is no longer a tech talent problem. According to PwC’s 2025 Global AI Jobs Barometer, workers with AI skills earned an average 56% wage premium in 2024 across every industry analyzed, up from 25% the prior year. For non-technical roles like Finance Analyst, HR Business Partner, and Operations Manager, this means that two candidates with the same job title can have materially different market values depending on whether their skill set includes AI tool proficiency, predictive modeling, or people analytics capability. Compensation bands that do not account for this skills-level differentiation will systematically underprice AI-capable hires in business functions and create internal compression between newer hires and existing team members whose skills have evolved. The fix requires benchmarking at the skills level, not just the title level, which is exactly what live job posting data enables.
5. How can CHROs and Total Rewards leaders use compensation intelligence to close pay equity gaps?
The most important shift is treating pay equity as a data problem rather than a reporting obligation. Internal pay audits tell you how your organization compares to itself, but they cannot tell you whether your salary ranges for specific roles are structurally out of step with what the live market is offering for equivalent positions in your sector and geography. Live job posting data fills that gap by surfacing which roles carry compressed ranges relative to market, which geographies show the widest spread between comparable titles, and which seniority levels show the sharpest gender pay divergence as you move up the ladder. According to Payscale’s 2025 Compensation Best Practices Report, 31% of organizations identify unfair pay as the primary reason for losing talent, which means the cost of inaction on pay equity shows up directly in attrition before it shows up in any compliance report. JobsPikr’s salary benchmarking tool gives Total Rewards leaders the external market context to make that analysis current, specific, and actionable.