With the rise of firmographic data as a major source of competitive intelligence, it can now be easily identifiable and assist in achieving strategic business decisions. In the modern world, a data centric approach is the most sought after path to success and firmographic data has emerged as a strong contender.
This article takes a look at how firmographic data can be leveraged to perform a better competitive analysis or even enhance segmentation analysis for clients and help investors and market intelligence work with more active information. Moreover, we will discuss ways to combine recruiting database to firmographic data sources more creatively.
What is Firmographic Data?
Every business possesses certain traits that when collected together form their firmographic data. This type of data allows market analysis through study of business characteristics, their market presence and operational strategies. Firmographic data is composed of :
- Industry: Defines the sector/domain a company operates in.
- Company Size: Refers to employee headcount and revenue scales.
- Geographic Location: Indicates a regional or global footprint.
- Growth Metrics: Quantifies year-on-year revenue growth or employee expansion.
- Ownership and Structure: Differentiates between public/private organizations and outlines the hierarchy.
Specific data points, such as firmographic data, allows a business to create a structure of their target audience and competitors, thus enabling them to devise strategies which are best suited for the given market.
Why Firmographic Data is Essential in Competitive Markets?
Examining firmographics provides insight into the competitive structure of the market. This data is useful for:
1. Pinpointing Market Leaders and Emerging Competitors
Beyond Basic Identification: Firmographics go beyond just naming competitors. Analyzing metrics like revenue growth rates, employee headcount trends, funding rounds, and specific industry specializations allows you to identify why leaders dominate (e.g., massive scale, niche expertise, superior efficiency) and how emerging players are disrupting (e.g., rapid growth in a new sub-sector, innovative business models, targeting underserved segments).
Strategic Benchmarking: By comparing your firmographics (size, revenue per employee, geographic footprint, tech stack) against leaders and relevant peers, you gain concrete benchmarks. This reveals performance gaps, operational inefficiencies, and areas where you might have a relative advantage.
2. Identifying Operational Gaps
Competitor Weakness = Your Opportunity: Analyzing competitor firmographics reveals their operational footprint. Where are they not present geographically? Which customer segments (by size, industry vertical) do they serve poorly or ignore? What technologies are they not adopting? These gaps represent underserved markets or inefficiencies you can exploit.
Strengths to Counter or Emulate: Conversely, understanding where competitors excel (e.g., dominant market share in a specific region, high penetration in a lucrative industry vertical, superior employee skillsets) helps you strategize counter-moves or identify best practices to adopt (if feasible).
3. Assessing Market Saturation
Quantifying the Competition: Firmographic data provides hard numbers on the density of competitors within a specific geographic area, industry niche, or customer segment. High density of similar-sized firms often indicates saturation, intense price competition, and lower margins.
Informed Market Entry/Expansion: Before entering a new market or launching a new product line, analyzing firmographics answers critical questions: Is there room? Who are the key players? What are their strengths? What customer segments are already overserved or underserved? This data is vital for calculating realistic market share potential and resource requirements.
How Recruiting Databases Enhance Market Analysis Strategies?
Recruiting databases (job boards, talent platforms, LinkedIn) are a goldmine of forward-looking competitive intelligence when filtered through a firmographic lens. They reveal competitors’ strategic intentions often before public announcements.
1. Labor Mobility
Hiring Patterns = Business Priorities: A sudden surge in job postings for specific roles (e.g., cloud architects, sustainability specialists, AI researchers) is a strong signal of where a competitor is investing heavily. Tracking hires from which companies also reveals talent poaching patterns and perceived industry leaders in specific domains.
Example: Mass hiring of data scientists and ML engineers strongly indicates a major push into AI/ML product development or data-driven operations.
2. Geographical Expansion Trends
Job Postings as Expansion Blueprints: Concentrated job ads in a new city, state, or country are a near-certain indicator of a competitor’s physical expansion plans into that region, often months before official openings.
Consolidation Signals: Conversely, a significant reduction in job postings or a cluster of layoff notices in a specific location can signal consolidation, retreat, or strategic refocusing away from that area.
3. Benchmarking Employee Profiles
Skills Gap Analysis: Analyzing the specific skills, experience levels, and qualifications sought by competitors in their job ads reveals their current workforce capabilities and future talent needs. What skills are they prioritizing that you lack?
Organizational Structure Insights: The types of roles being hired (e.g., new VP levels, specialized team leads) can hint at internal restructuring, new departments being formed, or shifts in management focus. Understanding the profile of talent competitors attract helps refine your own recruitment and retention strategies.
Top Firmographic Data Sources for Gaining Competitive Insights
A 360 view of firmographic data is only possible when there are good sources of information. Some of the leading firmographic sources are listed below:
1. Dedicated Business Intelligence Platforms: (e.g., Dun & Bradstreet, Hoovers, ZoomInfo, Statista)
Strengths: Provide vast, structured datasets covering company size, financials (estimates), industry codes, hierarchy linkages (parent/subsidiary), technographics, executive names, and often historical trends. Essential for broad market mapping and profiling.
2. Industry Reports & Market Research Firms: (e.g., Gartner, Forrester, IDC, IBISWorld, specialized niche firms)
Strengths: Offers deep, sector-specific analysis incorporating firmographics. Provide context on market size, growth rates, key player shares, trends, and often forward-looking predictions tailored to your industry.
3. Recruitment & Talent Intelligence Platforms: (e.g., LinkedIn Talent Insights, JobsPikr, SeekOut, specialized aggregators)
Strengths: Deliver real-time insights into hiring trends, workforce composition, skill demand, and geographical movement as discussed above. Provide the “people” dimension to firmographics.
4. Government & Public Records: (e.g., SEC filings (Edgar), national statistics bureaus, business registries, patent/trademark offices)
Strengths: Authoritative source for legally filed data (financials for public companies, registrations, locations), economic indicators, and industry classifications (NAICS/SIC). Crucial for validation and regulatory insights.
How to Effectively Integrate Firmographic Data into Your Business Plan?

Steps to Follow –
- Anchor to Clear Strategic Objectives:
- Define why you need the data: Is it to enter a new geographic market (focus on location density, competitor presence)? Launch a product for mid-sized manufacturers (focus on industry, company size, tech adoption)? Improve sales efficiency (focus on account prioritization based on size/industry)? Your goals dictate which firmographics are critical and how to analyze them.
- Aggregate and Harmonize Multi-Source Data:
- Don’t Rely on a Single Source: Combine data from BI platforms (core firmographics), recruitment aggregators (workforce trends), industry reports (context), and your CRM (existing customer profiles).
- Clean and Standardize: Ensure company names, industry codes (NAICS/SIC), location data, and metrics are consistent across sources for accurate merging and analysis. Data quality is paramount.
- Leverage Predictive & Prescriptive Analytics:
- Move Beyond Description: Use AI and ML models on historical firmographic and recruiting data to:
- Predict competitor moves (e.g., expansion likelihood based on hiring patterns).
- Identify emerging high-growth market segments.
- Forecast market saturation levels.
- Optimize sales territory planning and resource allocation.
- Prescribe actions (e.g., which specific accounts to target based on predictive scoring).
- Move Beyond Description: Use AI and ML models on historical firmographic and recruiting data to:
- Empower Decisions with Integrated Dashboards:
- Visualize Insights: Use BI tools (e.g., Tableau, Power BI, Looker) to create dashboards that synthesize key firmographic metrics relevant to different teams:
- Sales: Target account lists prioritized by size, industry, growth potential, tech stack compatibility.
- Marketing: Segmentation analysis, competitive positioning maps, market opportunity heatmaps.
- Product: Understanding target company needs and competitor offerings.
- Strategy: Market share analysis, competitor performance tracking, M&A target identification.
- Talent Acquisition: Competitor benchmarking for compensation, skills demand analysis, and identifying talent pools.
- Ensure Accessibility & Timeliness: Dashboards must provide near real-time data (where possible) and be easily accessible to stakeholders to drive agile decision-making.
- Visualize Insights: Use BI tools (e.g., Tableau, Power BI, Looker) to create dashboards that synthesize key firmographic metrics relevant to different teams:
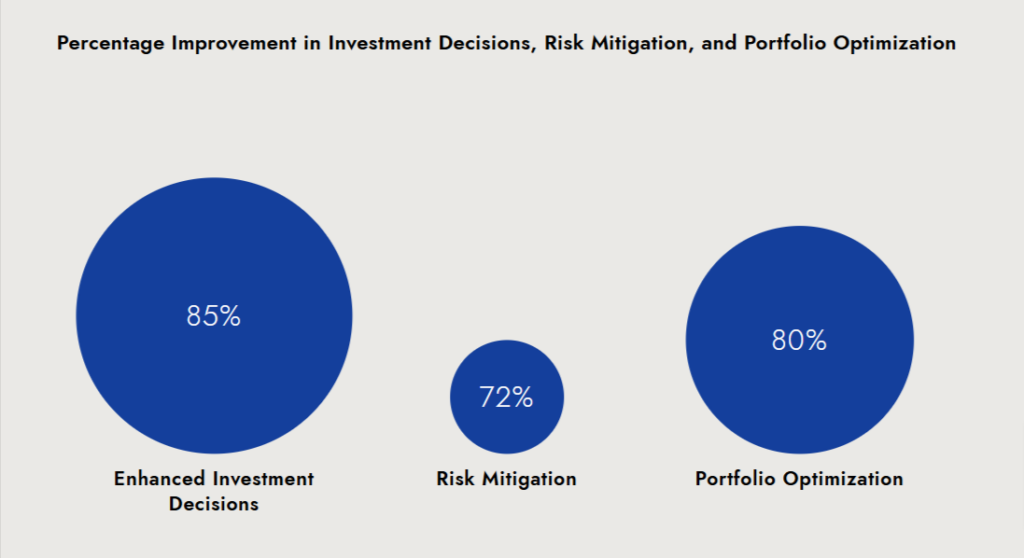
Key Benefits of Firmographic Data for Investors and Market Analysts
For investors and market intelligence teams, firmographic data offers unique advantages:
- Precision Targeting of Investment Opportunities:
- Identifying Alpha Generators: Firmographics reveal why market leaders dominate (e.g., superior margins via operational scale, defensible IP portfolios) and how high-growth firms achieve traction (e.g., disruptive tech adoption, capturing underserved niches identified through competitor gap analysis). This goes beyond simple financials to uncover the fundamental drivers of value.
- Spotting Emerging Winners Early: Analyzing recruiting data (surges in specialized hires, expansion into new markets) provides early signals of a firm’s strategic pivot or growth acceleration before it’s reflected in quarterly reports. Investing based on hiring for AI/ML roles before a company’s AI product launch is a prime example.
- Beyond Public Markets: For VC/PE, firmographics (industry concentration, founding team pedigree, tech stack maturity, talent density) are vital for assessing early-stage potential and later-stage scalability within specific sectors.
- Proactive Risk Mitigation:
- Quantifying Market Saturation Risk: Firmographic density analysis (e.g., high concentration of similar-sized competitors in a declining industry, stagnant employee growth across the sector) is a leading indicator of margin compression and consolidation risk. Investing in crowded, low-growth segments becomes inherently riskier.
- Identifying Operational & Strategic Weaknesses: Declining employee headcount, lack of investment in key technologies (visible via tech stack firmographics or absence of relevant tech hires), or retreat from key geographic markets signal underlying weakness and potential future financial distress.
- Regulatory & Geopolitical Exposure: Firmographics detailing operational locations, customer concentration by region/industry, and supply chain dependencies highlight vulnerability to specific regulatory changes or geopolitical instability. A firm heavily reliant on manufacturing in a single politically volatile region carries significant hidden risk.
- Talent Flight as a Red Flag: High attrition rates (inferred from constant replacement hiring) or difficulty filling critical roles (persistent job postings) signal cultural problems, compensation issues, or loss of competitive edge – major risk factors.
- Data-Driven Portfolio Optimization:
- Sector & Theme Allocation: Firmographic trends (e.g., mass adoption of cloud infrastructure across an industry, rapid hiring in renewable energy sectors, geographic shift of manufacturing hubs) inform macro bets on high-potential themes and optimal sector weighting.
- Geographic Diversification: Analysis of regional growth patterns (via firm expansion hiring, new entity registrations, economic data) helps balance exposure to emerging vs. mature markets and mitigate regional economic downturns.
- Counter-Cyclical Positioning: Identifying industries or regions showing firmographic resilience (stable hiring, maintained investment levels) during broader downturns allows for defensive positioning.
- M&A Target Identification & Due Diligence: Firmographics are fundamental for screening potential acquisitions (strategic fit based on size, industry, geography, tech) and uncovering risks (undetected market saturation, reliance on declining customer segments, talent gaps) during diligence. Integration feasibility hinges on understanding workforce profiles.
Future of Firmographic Data in Competitive Analysis: What’s Next?
As more companies adopt data as their primary decision-making tool, the firmographic data landscape will change. A few future developments include:
- AI-Driven Insights
AI will refine firmographic analysis by identifying hidden correlations and offering actionable recommendations faster. - Dynamic Data Integration
Real-time updates from IoT devices, economic indices, and recruitment platforms will make firmographic data more dynamic and contextually relevant. - Hyper-Personalization
Businesses will use firmographic insights to deliver highly customized solutions for specific customers or market segments.
Conclusion
Firmographic data is extremely useful in competitive analysis, customer engagement, and business development. The combination of this data with tools such as recruiting databases advance market competitiveness and bring new business insights.Take the next step in leveraging firmographic data to elevate your business strategies. Sign up on JobsPikr today and access powerful insights tailored to your industry and needs.