- The Quick Take: Open Skills and Talent Graphs in 2025
- What Are Open Skills and Talent Graphs?
- Open Skills vs. Proprietary Skills: Why the Distinction Matters
- The Numbers Behind Skills-First Transformation
- Want a tailored skills-graph briefing for your team?
- How Live Job Data Powers Skills Graphs
- Major Skills Graph Platforms and Their Approaches
- Open Standards: Building Common Ground
- How the Major Open Skills Frameworks Compare
- Implementation Challenges and Solutions
- Real-World Applications Across Industries
- Skills Evolution and Future Predictions
- Technology Architecture: How Skills Graphs Actually Work
- How to Adopt an Open Skills Framework in Your Organization: A Step-by-Step Guide
- Measuring Success: ROI and KPIs
- The Future of Work Language
- Want a tailored skills-graph briefing for your team?
- FAQs
The Quick Take: Open Skills and Talent Graphs in 2025
Open skills are skill definitions built on shared, vendor-neutral standards portable across your ATS, LMS, and HRIS without manual translation. Talent graphs map the relationships between those skills, connecting competencies to roles, career pathways, and live market demand.
Why it matters now: skills-based hiring has grown from 40% adoption in 2020 to 70% in 2026, the half-life of a technical skill is under 2.5 years, and 39% of existing skill sets will be outdated by 2030. Most organizations know they need a skills-first approach they’re just missing the infrastructure to act on it.
This article covers how open skills frameworks compare, how talent graphs work, where implementations fail, and how to measure ROI.
The job posting just landed in your inbox: “Seeking Data Scientist with Python, Machine Learning, and Business Intelligence experience.” Sounds straightforward until you realize those three skills connect to dozens of related capabilities, adjacent roles, and career pathways. Welcome to the world of skills graphs. Where traditional job descriptions become interconnected webs of competencies, relationships, and possibilities.
For L&D professionals and HR tech vendors, understanding these connections has become crucial. Skills-based hiring jumped from 40% adoption in 2020 to 60% in 2024. Companies using skills-first approaches are 107% more likely to place talent effectively. Yet only 20% of organizations embrace skills-based initiatives at scale.
The missing piece? A common language for open skills that everyone can speak.
What Are Open Skills and Talent Graphs?
Think of skills graphs as LinkedIn for competencies. Instead of connecting people, they map relationships between open skills, roles, and career pathways.
The Building Blocks
Skills Ontology creates the framework. It defines what each skill means and how it relates to others. Python programming connects to data analysis, which links to statistical modeling, which bridges to business strategy.
Skills Taxonomy provides the structure. It organizes open skills into hierarchical categories:
- Technical Skills → Programming → Languages → Python
- Soft Skills → Communication → Presentation → Public Speaking
Talent Graphs add the human element. They map how people actually use these skills in real roles across different industries and companies.
The “open” in open skills matters. Open skills initiatives create shared standards that work across platforms, companies, and geographic boundaries.
Why Traditional Job Categories Fall Short
Job titles tell incomplete stories. A “Marketing Manager” at a startup might handle everything from campaign strategy to graphic design to data analysis. The same title at a Fortune 500 company could mean pure people management.
Skills graphs capture this complexity. They show:
- Which skills actually cluster together in real jobs
- How skills transfer between roles and industries
- What learning paths connect current capabilities to future opportunities
- Where skill gaps exist in specific markets
Open Skills vs. Proprietary Skills: Why the Distinction Matters
Not all skill frameworks are created equal, and the difference between open and proprietary approaches has real operational consequences for HR teams.
What Makes a Skill Framework “Proprietary”
A proprietary skill framework is built, owned, and controlled by a single vendor. When you use Workday’s competency library, SAP SuccessFactors’ skills catalog, or a homegrown taxonomy built inside your ATS, those skill definitions only work within that system’s walls. They’re not designed to be portable, interoperable, or readable by other platforms without manual translation.
This creates three compounding problems:
Vendor lock-in. When your skill data is defined in a proprietary format, switching HR platforms means either losing your historical skills data or investing heavily in migration projects to re-map everything to the new system’s taxonomy.
Data silos between systems. Most enterprise HR stacks include an ATS, an LMS, a performance management tool, and a workforce planning platform, often from different vendors. If each uses its own skill language, you can’t get a single view of an employee’s capabilities across systems. A “data analysis” skill in your LMS won’t automatically connect to the “data analysis” requirement in your ATS unless someone manually maps them.
Inconsistent skill definitions across geographies. For global organizations, proprietary frameworks often lack the regional and linguistic nuance needed to accurately represent talent in different markets. What a proprietary system labels “project management” in the U.S. may not map cleanly to the equivalent competency clusters in Germany or Singapore.
What Makes a Skill Framework “Open”
An open skills framework is publicly documented, often governed by a standards body or government institution, and designed specifically for interoperability. Key characteristics include:
- Publicly accessible definitions — anyone can read, reference, and build on the taxonomy without licensing fees
- Persistent identifiers — each skill has a unique ID that stays stable across versions, so integrations don’t break when the framework updates
- Cross-mapping support — open frameworks are designed to be translated into each other, reducing the manual “cross-walking” effort when connecting systems
- Community governance — updates are driven by labor market research and industry input rather than a single vendor’s product roadmap
ESCO, O*NET, and the WEF Global Skills Taxonomy are the most widely adopted open frameworks in enterprise HR today.
The Cross-Walking Problem
Cross-walking refers to the process of translating skill definitions between two different frameworks: for example, mapping ESCO skill codes to O*NET equivalents when harmonizing data across a multinational HR stack. With proprietary frameworks, this is largely a manual exercise that requires ongoing maintenance every time either framework updates.
Open frameworks reduce this burden significantly because many maintain official crosswalk tables between them. O*NET and ESCO, for instance, have documented mapping layers that allow HR systems to exchange skills data without losing fidelity. This is why organizations building serious talent intelligence capabilities, the kind that can support internal mobility at scale, workforce gap analysis, and L&D targeting tend to anchor their skills architecture on open standards first, then enrich with proprietary data where needed.
The Numbers Behind Skills-First Transformation
The business case for open skills infrastructure shows up clearly in the data. The shift toward skills-based talent management shows up in concrete metrics:
Talent Pool Expansion:
- Skills-first hiring increases global talent pools by 5.8x
- In the United States: 15.9x increase
- Brazil sees 12.9x expansion
- United Kingdom: 8.4x growth
Industry-Specific Impact: Some sectors see dramatic talent pool multipliers when they drop degree requirements:
- Real Estate: 86.4x larger talent pool
- Utilities: 58.9x expansion
- Retail: 48.4x increase
- Financial Services: 44.5x growth

Business Performance: Companies embracing skills-based approaches report:
- 49% better efficiency in talent deployment
- 40% reduction in time-to-shortlist candidates
- Improved offer acceptance rates
- Enhanced retention through internal mobility
But challenges remain. 72% of companies cite talent shortages as a major challenge. 73% struggle with building talent pipelines.
The disconnect? Many organizations know they need skills-first approaches but lack the infrastructure to implement them effectively.
Want a tailored skills-graph briefing for your team?
Schedule a quick demo and we’ll deliver a short report showing how normalized job data maps skills, roles, and gaps in your target markets.
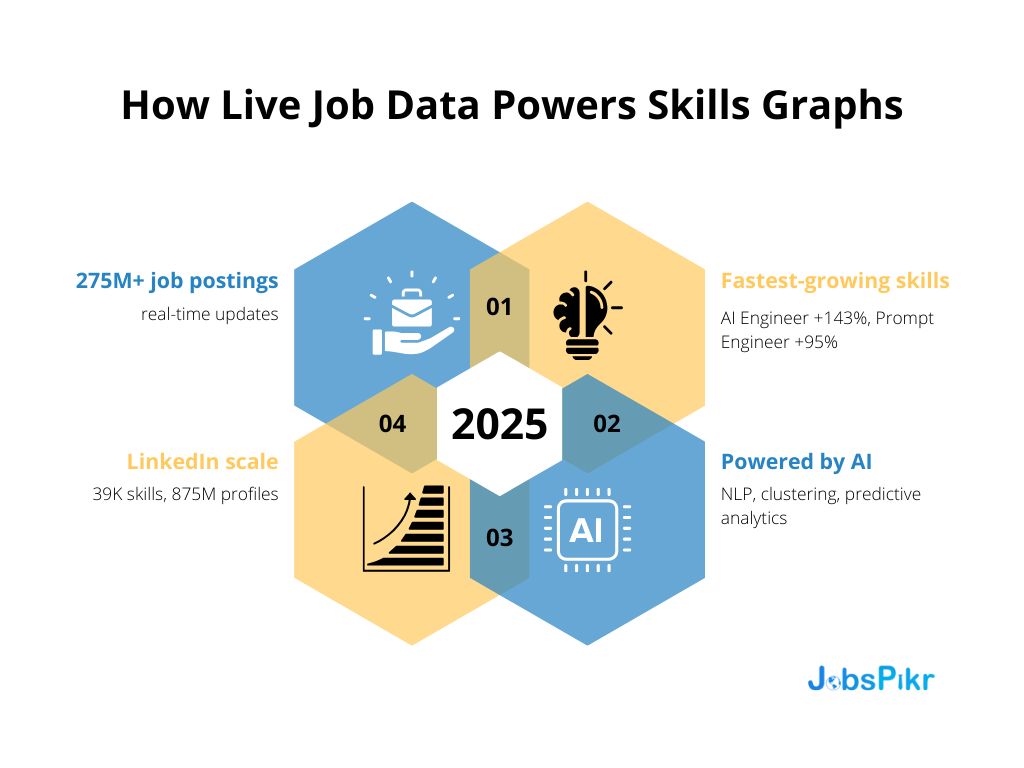
How Live Job Data Powers Skills Graphs
Traditional skills taxonomies relied on manual updates and expert committees. Modern open skills graphs update in real-time based on actual job market activity.
Real-Time Market Intelligence
Platforms like JobsPikr process 275 million global job postings across countries. This creates live insights into:
Emerging Skill Demands:
- AI Engineer roles grew 143.2% year-over-year
- Prompt Engineer positions surged 95.5%
- ML Engineer demand increased 35.3%
Skills Combinations: Job postings reveal which skills actually appear together. Data scientists need Python plus business acumen. DevOps engineers combine technical skills with project management capabilities.
Geographic Variations: The same role requires different skills in different markets. Marketing managers in tech hubs need more data analysis skills. Those in traditional industries focus on relationship building.
The LinkedIn Skills Graph Example
LinkedIn’s skills graph demonstrates the scale possible:
- 39,000 skills mapped across 26 languages
- 374,000 aliases (different names for the same skill)
- 200,000+ connections between skills
- 875 million member profiles analyzed
- 59 million companies included
The system updates constantly based on how people describe their work, what open skills they add to profiles, and which capabilities appear together in job postings.
Machine Learning Powers the Connections
Modern skills graphs use AI to identify patterns humans might miss:
Natural Language Processing extracts skills from unstructured job descriptions and resumes.
Clustering Algorithms group related skills and identify new combinations.
Deep Learning understands context. “Java” in a coffee shop job posting means something different than “Java” in a software development role.
Predictive Analytics forecast which skills will become more valuable based on industry trends and emerging job patterns.
Major Skills Graph Platforms and Their Approaches
Different platforms take varying approaches to skills mapping:
LinkedIn’s Structured Framework
LinkedIn focuses on professional networking data:
- Maps skills to actual job performance
- Tracks skill adjacencies (what skills transfer easily)
- Updates based on member activity and hiring patterns
- Provides real-time market insights
40% of hirers now explicitly use LinkedIn’s skills data in their sourcing strategies.
Microsoft’s Integration Play
Microsoft Copilot automatically infers skills from user activity:
- Analyzes documents, emails, and project participation
- Suggests skills additions based on work patterns
- Integrates with talent management systems
- Provides personalized learning recommendations
Specialized HR Tech Players
Textkernel maps 4,500 professions to 12,000 unique skills.
Celential.ai covers 15M+ engineering professionals and 5M+ sales talent.
iMocha assesses 3,000+ skills with a 4.4/5 G2 rating.
Each platform brings different strengths in data coverage, update frequency, and integration capabilities.
Open Standards: Building Common Ground
The open skills ecosystem works best when different platforms can communicate. Several initiatives work toward common standards:
World Economic Forum Global Skills Taxonomy
Creates a shared language for skills across industries and countries. Focuses on:
- Core skill definitions that translate globally
- Relationship mapping between technical and human skills
- Future skills prediction based on economic trends
ESCO (European Framework)
The European Union’s approach includes:
- 13,500 distinct skills mapped since 2017
- Multi-language support across EU countries
- Integration with education and training systems
- Regular updates based on labor market research
O*NET‘s Comprehensive Database
The U.S. Department of Labor maintains:
- 35 skill categories
- 923 occupational titles
- 177 total skill elements
- Regular surveys of actual workers
These open standards solve the “cross-walking” problem. Organizations can map between different skills taxonomies without losing information or starting from scratch.
How the Major Open Skills Frameworks Compare
Each framework takes a different approach to defining and organizing skills. Here’s how they stack up for common HR use cases:
| Framework | Owner | Skills Covered | Geography | Update Frequency | Best For |
| O*NET | U.S. Dept. of Labor | 177 skill elements across 923 occupations | United States | Annual surveys + rolling updates | Job architecture, compensation benchmarking, U.S. workforce planning |
| ESCO | European Commission | 13,500+ skills and competences | EU + multilingual (27 languages) | Version releases every 2–3 years | Cross-border hiring, EU compliance, education-to-work mapping |
| WEF Global Skills Taxonomy | World Economic Forum | 1,000+ core skills with future-of-work weighting | Global | Tied to Future of Jobs Report cycle | Strategic workforce planning, skills forecasting, cross-industry benchmarking |
| LinkedIn Skills Graph | LinkedIn / Microsoft | 39,000 skills, 374,000 aliases | Global | Continuous (real-time) | Talent sourcing, market benchmarking, internal mobility at scale |
| ISCO | International Labour Organization | Occupational classifications mapped to skills | Global | Periodic revisions | Global job family design, multi-country HR standardization |
What this means: No single framework covers everything. Most enterprise HR teams use ONET or ESCO as their foundational taxonomy, then layer in a real-time data source like LinkedIn or JobsPikr to capture emerging skills that formal frameworks haven’t yet catalogued. The gap between what ONET lists and what job postings actually require can be 12–18 months, which is where live job data becomes essential.
Implementation Challenges and Solutions
Despite clear benefits, skills graph adoption faces real obstacles:
Data Quality Issues
Skills data comes from multiple sources with varying quality:
- Job postings often contain outdated or inaccurate skill requirements
- Resume data includes self-reported capabilities without validation
- Learning platforms track course completion but not actual competency
Solutions:
- AI-powered data cleaning and validation
- Cross-referencing multiple data sources
- Regular audits by subject matter experts
- Feedback loops from hiring managers and employees
Integration Complexity
Most organizations use multiple HR systems that don’t talk to each other:
- Applicant tracking systems with their own skills taxonomies
- Learning management platforms with different skill frameworks
- Performance management tools using custom competency models
Solutions:
- API-first platforms that connect existing systems
- Open standards that reduce vendor lock-in
- Phased implementation starting with high-impact use cases
- Change management programs for user adoption
ROI Measurement Difficulties
Only 30% of HR tech implementations succeed according to BCG research. 35% of HR leaders feel confident in the tools they’re implementing.
Success Factors:
- Clear objectives defined before implementation
- Regular ROI measurement and adjustment
- Strong user adoption programs
- Executive sponsorship and support
Real-World Applications Across Industries
Skills graphs drive value in multiple use cases:
Strategic Workforce Planning
Before: “We need to hire 50 software developers.”
After: “We need capabilities in cloud architecture, API development, and data pipeline management. Here’s how our current team maps to these needs, what gaps exist, and whether we should hire, train, or partner.”
Companies like IBM report 45% productivity increases through skills-based training programs that address specific capability gaps.
Internal Mobility Optimization
Traditional Approach: Employees apply for open positions based on job titles and basic qualifications.
Skills-Graph Approach: The system identifies employees whose current skills map well to open roles, even in different departments. It suggests specific learning paths to bridge any gaps.
Marriott achieved 20% operational efficiency improvements by helping employees move into roles that better matched their developing skill sets.
Learning and Development Targeting
Old Method: Generic training programs based on job levels or departments.
New Method: Personalized learning paths based on individual skill gaps, career goals, and market demand trends.
The average LMS ROI increased to 353% according to Brandon Hall Group research when organizations moved to skills-based learning approaches.
Skills Evolution and Future Predictions
Skills themselves evolve rapidly. The half-life of skills has dropped to under 5 years overall and just 2.5 years in technology fields.
Current Transformation Trends
Most In-Demand Skills (2025):
- Analytical thinking: 70% of companies consider it essential
- Resilience and flexibility: Critical in rapidly changing markets
- Creative thinking: Increasingly important as routine tasks get automated
- Curiosity and lifelong learning: Essential for continuous skill development
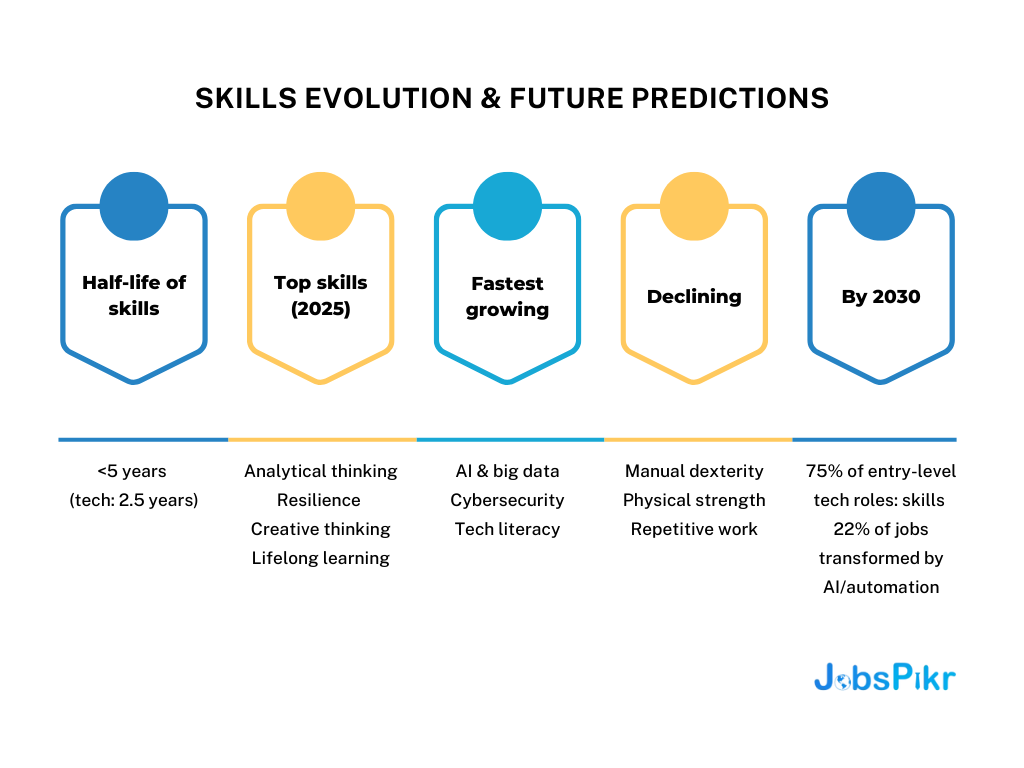
Fastest Growing Areas:
- AI and big data capabilities
- Networks and cybersecurity expertise
- Technology literacy across all roles
Declining Skills:
- Manual dexterity for routine tasks
- Physical strength requirements
- Repetitive precision work
Looking Forward
75% of entry-level tech roles will prioritize skills over degrees by 2030 according to LinkedIn research. This trend will likely spread to other industries as skills-based hiring proves its effectiveness.
22% of all jobs face transformation by 2030 due to automation and AI. Skills graphs will become essential for helping workers navigate these transitions.
The Continuous Learning Challenge
Skills instability has actually decreased from 57% in 2020 to 40% in 2025. This suggests that while new skills emerge constantly, core competencies maintain relevance longer than initially predicted.
However, 50% of workers completed some form of training, reskilling, or upskilling in 2024, up from 41% in 2023. The pressure for continuous learning continues to intensify.
Technology Architecture: How Skills Graphs Actually Work
Understanding the technical foundation helps L&D and HR tech professionals make better platform decisions:
Data Collection Methods
Job Posting Analysis: Natural language processing extracts required skills from millions of job descriptions across industries and geographies.
Profile Mining: Skills data comes from professional profiles, resumes, and career histories.
Learning Activity Tracking: Course completions, certification achievements, and skill assessments provide validated competency data.
Performance Correlation: The most advanced systems track which skills actually correlate with job performance, not just job requirements.
Machine Learning Applications
Clustering Algorithms identify which skills naturally group together in real work environments.
Deep Learning Models understand context and extract skills from unstructured text with high accuracy.
Predictive Analytics forecast which skills will become more or less valuable based on industry trends and economic factors.
Recommendation Engines suggest relevant skills, roles, or learning paths based on individual profiles and market conditions.
Update Frequencies and Validation
The best skills graphs update continuously:
- Real-time ingestion of new job postings and profile changes
- Weekly algorithm updates based on market activity patterns
- Monthly expert validation of new skill relationships
- Quarterly comprehensive reviews of taxonomy structure
How to Adopt an Open Skills Framework in Your Organization: A Step-by-Step Guide
Understanding open skills conceptually is one thing. Getting them to work inside a real HR stack — with existing systems, legacy data, and competing stakeholder priorities — is another. Here’s a practical path forward.
Step 1: Audit Your Current Skills Data
Before choosing a framework, map what you already have. Identify every system in your HR stack that stores skills data — your ATS, LMS, HRIS, performance management tool, and any job architecture documentation. For each system, document: what skill taxonomy it uses, how frequently it’s updated, who owns it, and whether it can export or receive skills data via API. This audit will reveal where your biggest data silos are and where interoperability will deliver the fastest ROI.
Step 2: Choose a Foundation Framework Based on Your Geography and Use Case
If your workforce is primarily U.S.-based, O*NET provides the most granular occupational data and the deepest integration with compensation and job architecture tools. If you operate across the EU or hire cross-border, ESCO’s multilingual structure gives you the consistency needed for compliant, comparable skills data. For organizations focused on future skills forecasting and executive-level workforce strategy, the WEF Global Skills Taxonomy offers the most forward-looking lens. Most large enterprises end up anchoring on one primary framework and using crosswalk tables to connect secondary ones.
Step 3: Enrich Your Foundation with Real-Time Job Market Data
Open frameworks update on annual or biannual cycles. The job market moves faster than that. Emerging skills like prompt engineering, AI governance, and retrieval-augmented generation appeared in job postings 12–18 months before any formal taxonomy catalogued them. To close this lag, layer a live job data source on top of your foundation framework. This gives your skills graph a continuously updated view of what the market actually demands — not just what a committee decided two years ago.
Step 4: Start With One High-Value Use Case
The organizations that fail at skills graph implementation typically try to boil the ocean — launching enterprise-wide skills transformation before the foundation is stable. Pick one use case with clear ROI: internal mobility matching, targeted L&D for a specific job family, or skills-based sourcing for a high-volume role. Prove the value, measure it, and use that data to build the business case for broader adoption.
Step 5: Establish a Skills Governance Model
Skills data degrades quickly. Job requirements shift, new competencies emerge, and old skills lose relevance. Without a governance process, your skills graph will become stale within 18 months. Assign ownership — typically a small team spanning HR technology, L&D, and talent acquisition — and define a review cadence. Quarterly reviews of the most business-critical skill clusters, with annual full taxonomy audits, is a workable starting point for most organizations.
Step 6: Connect Skills Data Across Systems Using APIs
The goal of an open skills architecture is a single, consistent view of skills across every HR system. Use your foundation framework’s persistent skill identifiers as the common key to connect data between platforms. Most modern ATS, LMS, and HRIS platforms support API integrations — the open skills identifiers give you the shared language those integrations need. Where direct API connectivity isn’t available, flat-file exports using standardized skill codes are a workable interim approach.
Step 7: Measure, Report, and Iterate
Define your baseline metrics before you launch — time-to-shortlist, internal mobility rate, L&D completion rates for targeted skill gaps, and offer acceptance rates for skills-matched candidates. Review these quarterly against your pre-implementation baseline. The organizations that sustain skills graph adoption are the ones that can show measurable improvement in these numbers within the first six months — which makes continued investment easy to justify.
Measuring Success: ROI and KPIs
Successful skills graph implementations track specific metrics:
Talent Acquisition Improvements
- Time-to-shortlist reduction (average 40% improvement)
- Candidate quality scores based on skills matching
- Offer acceptance rates for skills-matched candidates
- Source diversity when skills-first hiring opens new talent pools
Internal Mobility Enhancement
- Employee retention rates for skills-based role transitions
- Time-to-productivity for internal moves
- Career pathway completion rates
- Employee satisfaction scores for development opportunities
Learning and Development Optimization
- Skills gap closure rates after targeted training
- Learning path completion percentages
- Competency assessment improvement scores
- Business impact measurement for newly acquired skills
Accenture reported 20% performance increases and 30% client satisfaction improvements after implementing comprehensive skills-based talent management.
The Future of Work Language
Open skills and talent graphs represent more than new HR technology. They create a common language for describing human capability that works across organizations, industries, and geographic boundaries.
For L&D professionals, this means:
- More targeted and effective training programs
- Better career pathway guidance for employees
- Clearer ROI measurement for learning investments
- Stronger alignment with business strategy
For HR tech vendors, the opportunity includes:
- Integration points with existing talent management systems
- Real-time market intelligence that improves platform value
- Differentiation through superior skills mapping and prediction
- New revenue streams from skills analytics and consulting
The companies winning this open skills transformation understand that skills graphs require both sophisticated technology and human insight. The best platforms combine real-time job market data with expert knowledge, machine learning capabilities with user-friendly interfaces, and global standards with local market understanding.
As work continues evolving at unprecedented speed, the organizations with the most accurate and actionable intelligence will have sustainable competitive advantages in finding, developing, and deploying human talent. The new language of work is being written in real-time. The question for L&D and HR tech leaders is whether they’ll help author that language or simply try to keep up with it.
Want a tailored skills-graph briefing for your team?
Schedule a quick demo and we’ll deliver a short report showing how normalized job data maps skills, roles, and gaps in your target markets.
FAQs
1. What is an open skill?
An open skill is one performed in a changing environment where conditions are unpredictable. For example, playing tennis is an open skill because the ball, opponent, and pace can vary each time.
2. What do you mean by open skills?
“Open skills” mean a skill that requires constant adjustment because the situation is always changing. These skills often involve interaction with people, objects, or environments that are not under full control.
3. What is an example of an open task?
An open task is an activity where the outcome depends on external conditions. For example, giving a presentation to a live audience is an open task because questions or reactions can change how you deliver it.
4. What are the 5 C’s of talent?
The 5 C’s of talent typically refer to: Competence, Character, Commitment, Communication, and Collaboration. These are seen as core attributes for effective workforce performance.
5. What is talent mapping in HR?
Talent mapping is the process HR uses to identify current skills in the workforce, forecast future needs, and plan hiring, training, or mobility to close skill gaps. It connects business strategy with people’s capability.
6. What are open skills in HR and talent management?
Open skills in HR refers to a skill defined using shared, vendor-neutral standards that can be understood and used across different platforms, companies, and geographies. Unlike proprietary skill definitions locked inside a single ATS or HR system, open skills are part of frameworks like ESCO, O*NET, or the WEF Global Skills Taxonomy meaning a “data analysis” skill means the same thing whether you’re using LinkedIn, Workday, or a custom internal tool. This interoperability is what makes open skills foundational to skills-based hiring at scale.
7. What is the difference between a skills taxonomy and a skills ontology?
A skills taxonomy organizes skills into a structured hierarchy, for example, Technical Skills → Data Skills → Python. It tells you what skills exist and how they’re categorized. A skills ontology goes further by mapping the relationships between skills how Python connects to machine learning, which connects to business intelligence, which connects to strategy roles. Talent graphs are built on ontologies, not just taxonomies, because understanding skill relationships is what enables internal mobility recommendations, career path mapping, and workforce gap analysis.
8. How do open skills frameworks improve internal mobility?
When skills are defined using open, standardized language, it becomes possible to compare an employee’s current skill set against the requirements of roles across the entire organization not just their department. A proprietary framework limits this comparison to whatever roles exist within a single vendor’s system. Open skills frameworks allow HR teams to identify, for example, that a customer success manager has 70% of the skills needed for a product operations role, and to prescribe a specific learning path to bridge that gap. This is how companies like Marriott have driven measurable improvements in internal placement rates.
9. What is a talent graph and how is it used in workforce planning?
A talent graph is a structured data model that maps relationships between skills, job roles, people, and career pathways. It goes beyond a simple skills inventory by capturing how skills cluster together in real jobs, which roles share overlapping skill requirements, and how skills evolve over time based on live job market data. In workforce planning, talent graphs help HR leaders answer questions like: where are our biggest skill gaps relative to our three-year strategy, which teams have transferable talent we’re under-utilizing, and which roles are at highest risk of disruption by automation.
10. What is the difference between open skills and proprietary skill frameworks?
Proprietary skill frameworks are built and owned by a specific vendor; they work well within that vendor’s ecosystem, but create data silos when you try to connect them to other systems. Open skills frameworks, by contrast, are publicly documented, often community-governed, and designed to be interoperable. The practical difference shows up during system migrations, multi-vendor HR stacks, or cross-border hiring: with open skills, you don’t lose data fidelity when moving between tools. For enterprise HR teams managing multiple platforms, open standards significantly reduce the “cross-walking” effort needed to translate skill definitions from one system to another.