- **TL;DR**
- What is Qualitative Data?
- Qualitative vs. Quantitative Data: Understanding the Difference
- 8 Essential Qualitative Data Types for HR Analytics
- See how Jobspikr turns messy job data into strategy.
- How to Collect Qualitative Data: Methods and Best Practices
- How to Analyse Qualitative Data
- The Integration Strategy: Making Qualitative + Quantitative Work
- Implementation Best Practices
- The Strategic Impact: Why This Matters Now
- Moving Forward: Your Next Steps
- See how Jobspikr turns messy job data into strategy.
- FAQs
**TL;DR**
The statistics illustrate what happened; qualitative data describes the rationale. Collect and synthesize the employee story data—open comments on surveys, exit interviews, 1:1 interviews, focus groups, 360 feedback, observational notes as well as external job market diagnostic info (skills, pay, cascading roles). The combination surfaces turnover root causes, precise skills-and-culture shortfalls, and specific fixes (training, redesigned roles, coached managers). The saving grace is improved risk detection, retention, and predictive people analytics as opposed to just historical reporting.
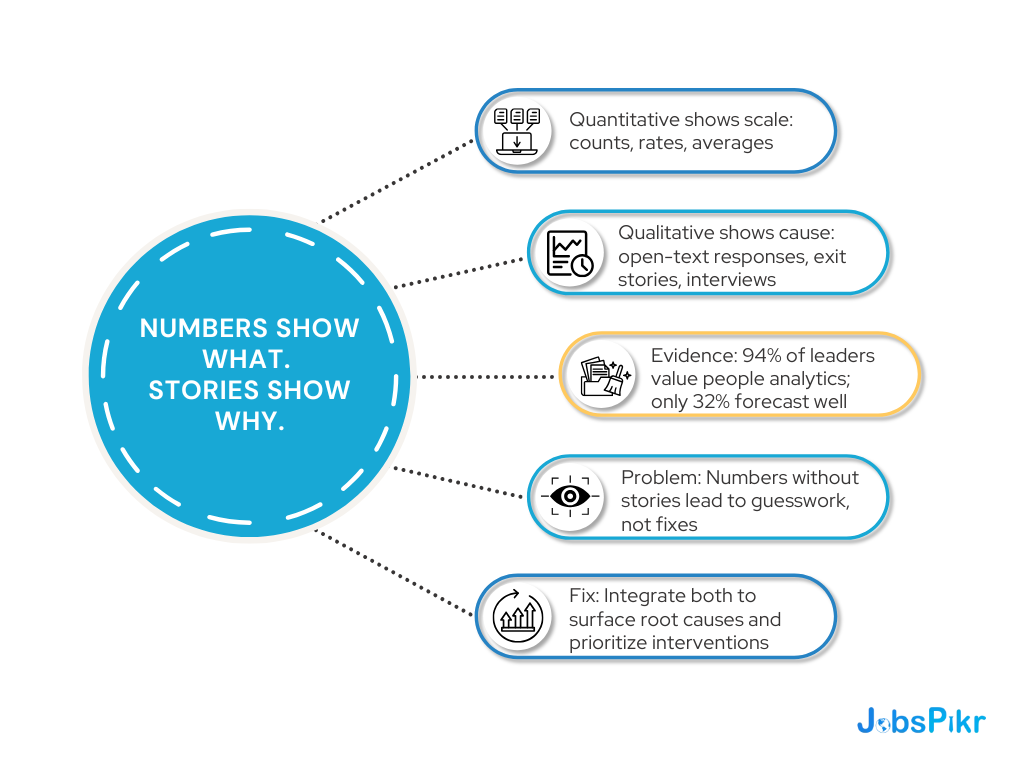
Numbers tell you what happened. Stories tell you why it happened. If you’re diving into people analytics, you’ve probably noticed something: spreadsheets full of turnover rates and satisfaction scores only give you half the picture. The other half is in the messy data. Think about it this way. Your dashboard shows a 15% spike in engineering departures. That’s your “what.” But without the “why” – the actual reasons people are leaving – you’re just staring at a problem without understanding how to fix it. This is where qualitative data becomes your secret weapon.
What is Qualitative Data?
Qualitative data is non-numerical information that describes qualities, characteristics, experiences, and meanings. Rather than measuring how much or how many, it captures what, why, and how — the texture and context behind events and behaviours that numbers alone cannot convey.
The word “qualitative” comes from the Latin qualitas, meaning nature or character. In research and analytics, it refers to any data that is expressed in words, descriptions, narratives, observations, or categories rather than in numerical values. It is inherently subjective and interpretive, which is both its limitation and its greatest strength — it gets closer to the lived reality of human experience than any metric can.
Simple qualitative data examples across different contexts:
- A patient describing their hospital experience as “rushed and impersonal” (healthcare)
- A customer saying a product “feels cheap despite looking premium” (market research)
- A student explaining that a course “made sense in theory but gave no practical examples” (education)
- A user noting that an app “takes too many steps to do something simple” (UX research)
- An employee writing that they feel “overlooked for promotions despite strong performance reviews” (HR)
- A job candidate saying an interview process felt “disorganised and made me question the company’s culture” (recruitment)
In every case, the qualitative data adds meaning that a numerical rating — say, 5/10 for “hospital experience” or 3/5 for “course quality” — cannot capture on its own. The number tells you a response was negative. The words tell you exactly why and what would need to change.
Key characteristics of qualitative data:
- Descriptive and contextual: Expressed in words, images, sounds, or observations — not numbers
- Subjective: Reflects the perspective, experience, and interpretation of the source
- Inductive: Meaning emerges from the data itself, rather than being tested against a pre-set hypothesis
- Flexible and emergent: The scope of what’s captured can evolve as patterns surface during collection
- Rich in nuance: Captures complexity, contradiction, and context that structured surveys flatten out
- Harder to scale: Requires more time and analytical skill to process than numerical data, though NLP and AI tools are changing this rapidly
Qualitative vs. Quantitative Data: Understanding the Difference
Quantitative data answers questions like:
- How many people left last quarter?
- What’s our average satisfaction score?
- How often do we promote internally?
Qualitative data digs deeper:
- Why are people actually leaving?
- What does “dissatisfied” really mean to your employees?
- How do people experience your promotion process?
| Dimension | Qualitative data | Quantitative data |
|---|---|---|
| Format | Words, narratives, descriptions, observations | Numbers, measurements, percentages, counts |
| Question answered | Why? How? What does it mean? | How many? How much? How often? |
| Collection methods | Interviews, focus groups, open-ended surveys, observation | Structured surveys, metrics tracking, sensors, databases |
| Analysis approach | Thematic coding, narrative analysis, content analysis | Statistical analysis, regression, aggregation |
| Output | Themes, patterns, insights, interpretations | Averages, trends, correlations, scores |
| Strengths | Rich context, captures nuance, surfaces root causes | Scalable, comparable, statistically verifiable |
| Limitations | Time-intensive to analyse, harder to generalise | Misses context, can’t explain the “why” behind numbers |
| HR example | Exit interview explaining why someone left | Turnover rate: 15% last quarter |
The magic happens when you combine both. Recent research shows that 94% of business leaders believe people analytics elevates HR’s strategic impact. But here’s the catch – only 32% of organizations actually use forecasting capabilities effectively.
The gap? Most teams focus heavily on numbers but miss the narrative context that makes those numbers actionable.
8 Essential Qualitative Data Types for HR Analytics
1. Employee Survey Open-Ended Responses
Your engagement survey might show a 6.2/10 satisfaction score. Useful, but not actionable. The real insights hide in the comment boxes.
What you’ll typically find:
- “I want better opportunities for professional development and training”
- “Communication from upper management feels disconnected from our daily reality”
- “Flexible work arrangements would improve my work-life balance”
Why this matters: These responses reveal specific pain points behind your numerical ratings. Instead of guessing why satisfaction dropped, you get direct feedback on what to fix.
Pairing with job signals: If multiple employees mention lacking “cloud certifications” in development feedback, cross-reference with job market data. You might discover that AWS-certified engineer postings increased 67% in your area – explaining why your team feels behind.
2. Exit Interview Narratives
Exit interviews generate two types of data: structured ratings and open-ended stories. The stories matter more.
When someone rates “management effectiveness” as a 3/10, that’s helpful. When they explain: “My manager consistently took credit for team wins while publicly criticizing individual mistakes in meetings” – now you have something actionable.
Key patterns to track:
- Specific management behaviors causing friction
- Compensation gaps compared to market offers
- Cultural misalignments affecting day-to-day experience
- Career development roadblocks
Real-world impact: IBM’s predictive system analyzes exit interview patterns with 95% accuracy to identify at-risk employees. This approach saved them nearly $300 million in retention costs.
Job signal integration: When exit interviews consistently mention “limited growth opportunities,” analyze job posting trends in your industry. Are competitors suddenly posting senior-level roles with skills your team wants to develop? This external signal helps you understand if the problem is internal processes or market evolution.
3. Performance Review Behavioral Feedback
Rating someone’s communication as “4/5” tells you very little. The qualitative feedback tells you everything.
Effective behavioral observations look like:
- “You consistently ensure team members feel heard by encouraging open discussions during meetings”
- “Instructions sometimes lack clarity, leading to project misinterpretations and delays”
- “Your conflict resolution approach – staying calm and facilitating respectful dialogue – has improved team dynamics significantly”
Analysis framework: Look for behavioral patterns across review cycles. Are multiple managers noting similar communication challenges? Are leadership behaviors consistent across different teams?
Market context pairing: If performance reviews consistently highlight “needs better technical skills,” examine job posting requirements in your industry. When 78% of similar roles now require Power BI expertise, individual skill gaps become strategic priorities.
4. Focus Group Insights
Focus groups show perspectives that can be missed in individual surveys. The group shows insights that a lot of times people don’t share one-on-one.
What makes focus groups valuable:
- Participants build on each other’s ideas
- Group discussions reveal shared experiences
- Consensus emerges around key issues
- Non-verbal communication adds context
Typical applications:
- Understanding how teams really feel about new policies
- Gathering honest feedback on training effectiveness
- Exploring reactions to organizational changes
- Assessing leadership transitions
Strategic pairing: If focus groups reveal concerns about “falling behind on industry trends,” validate with job market analysis. Are skill requirements evolving faster than your training programs? External job signals provide the context for internal concerns.
5. One-on-One Interviews
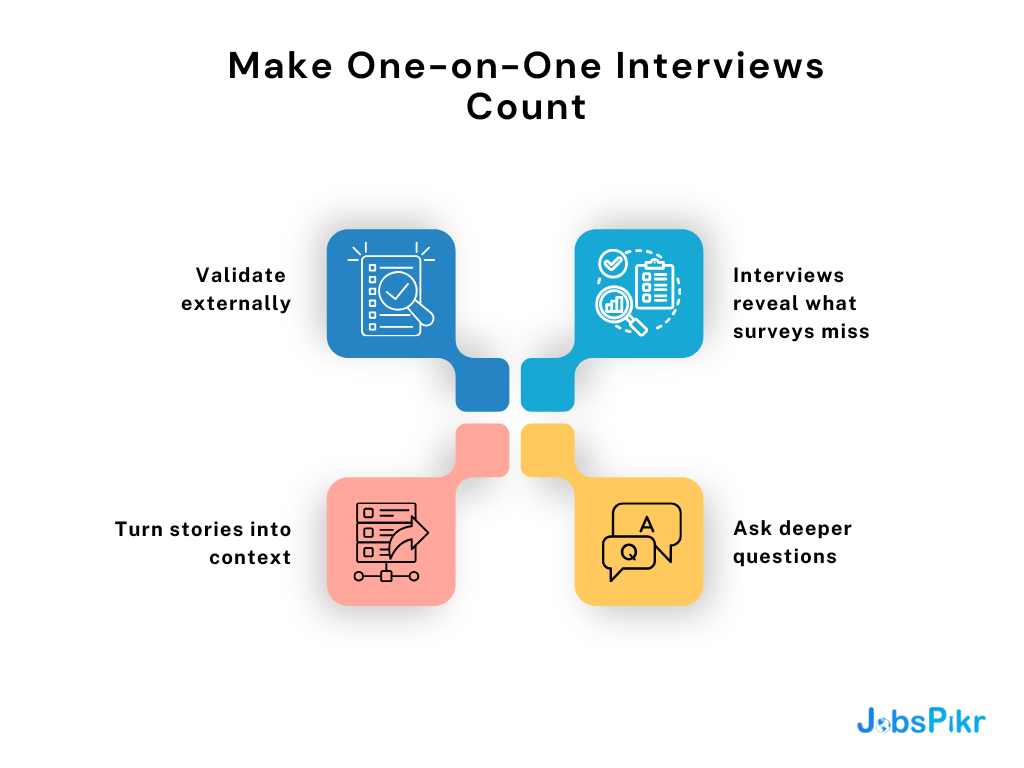
Individual interviews show motivations and challenges that broader surveys don’t get.
The key is moving beyond standard questions to explore actual experiences:
- What specific moments made you feel most engaged this year?
- Describe a time when you felt truly supported by leadership
- What would need to change for you to see a clear career path here?
Data richness: Personal narratives reveal emotional drivers behind engagement scores. Individual stories provide context for broader patterns.
External validation: When interviews reveal salary concerns, compare with real-time job posting data. If similar roles show 15-20% higher compensation in your market, individual concerns become strategic compensation issues.
6. Cultural Assessment Stories
Culture surveys produce numerical ratings, but cultural stories reveal how values actually play out in daily work.
What to capture:
- How employees experience organizational values in practice
- Real examples of cultural behaviors (positive and negative)
- Stories about inclusion and belonging
- Narratives about how culture has changed over time
Analysis approach: Compare espoused values with experienced reality. Are there gaps between what leadership communicates and what employees experience?
Job market connection: Cultural concerns often connect to external market pressures. If employees feel “behind on innovation,” job posting analysis might reveal competitors emphasizing cutting-edge technologies in their employer branding.
7. 360-Degree Feedback Commentary
360 degree feedback gives rich qualitative data from managers, peers, and direct reports.
Valuable qualitative elements:
- Specific examples of leadership impact
- Detailed collaboration stories
- Communication style descriptions
- Targeted development suggestions
Pattern recognition: Look for consistent themes across different feedback sources. When multiple perspectives align on specific behaviors, you’ve identified reliable development areas.
Market relevance: If 360 feedback consistently notes “needs stronger digital leadership skills,” external job analysis can reveal whether this reflects market evolution or internal gaps.
8. Workplace Observational Data
Sometimes the most valuable insights come from watching actual behavior rather than asking about it.
Observation categories:
- Meeting participation patterns
- Collaboration frequency and quality
- Workspace utilization
- Informal communication networks
Why observation matters: People often report what they think they should do and not what they actually do.
Quantitative pairing: If observations show declining cross-team collaboration, job market analysis might reveal whether similar roles increasingly emphasize “collaborative skills” – indicating market pressure for better teamwork.
See how Jobspikr turns messy job data into strategy.
Schedule a quick demo to see sample dashboards, a normalized job dataset in action, and how qualitative signals integrate with market data.
How to Collect Qualitative Data: Methods and Best Practices
Knowing the types of qualitative data available is only half the equation. How you collect it determines whether you get rich, actionable insights or vague responses that are impossible to analyse systematically.
Interviews (structured, semi-structured, and unstructured)
Interviews are the most versatile qualitative collection method. In HR contexts, they appear as exit interviews, stay interviews, onboarding check-ins, and leadership assessments. The key distinction is structure level:
- Structured interviews use a fixed set of questions asked in the same order to every participant — easier to analyse across a large group but less likely to surface unexpected insights
- Semi-structured interviews use a guide of core questions but allow the interviewer to follow interesting threads — the most common format in HR because it balances consistency with depth
- Unstructured interviews are open conversations guided only by a broad topic — best for exploratory research where you don’t yet know what questions to ask
Best practice: Record and transcribe where possible (with participant consent). Verbatim transcripts allow for thematic coding later. Summaries written from memory lose the specific language that often contains the most diagnostic value.
Focus Groups
Focus groups bring 6–10 participants together to discuss a topic, with a facilitator guiding the conversation. They are particularly useful for understanding shared experiences, building consensus, and exploring how employees collectively interpret organisational changes or policies.
Best practice: Keep groups homogeneous enough for participants to speak freely — mixing junior employees with their direct managers in the same focus group typically suppresses honest responses. Run separate sessions by level or function and compare themes across groups.
Open-Ended Survey Questions
The most scalable qualitative collection method in HR. A single well-designed open-ended question appended to a pulse survey — “What is the one thing that would most improve your experience at work?” — can generate hundreds of qualitative responses in a single week.
Best practice: Limit to two or three open-ended questions per survey. More than that and response rates drop sharply and response quality degrades. Use consistent question wording across survey cycles so that responses can be compared over time.
Observation and Ethnographic Methods
Direct observation — watching how teams actually work, communicate, and collaborate — surfaces qualitative data that self-report methods cannot. People consistently describe their behaviour differently from how they actually behave. Observational data captures the gap.
Best practice: In workplace settings, observation works best when it is transparent and when the observer is present long enough for participants to stop performing for the audience. Short, announced observation sessions typically produce less authentic data than extended presence.
Document and Artefact Analysis
Performance review records, internal communications, project post-mortems, and even the language used in job descriptions and internal job postings are all sources of qualitative data. They reflect organisational values, priorities, and communication norms in ways that structured surveys cannot.
Best practice: Treat documents as cultural artefacts — not just information sources. The language an organisation uses in internal communications often reveals assumptions and priorities that formal surveys would never surface.
How to Analyse Qualitative Data
Qualitative data is only as useful as the analysis that structures it. Without a systematic approach, large volumes of interview transcripts, open-ended survey responses, and observational notes become unmanageable. These are the core methods HR teams use to turn raw qualitative data into actionable insight.
Thematic Analysis
Thematic analysis is the most widely used qualitative analysis method in HR contexts. It involves reading through qualitative data and identifying recurring patterns — called themes — that capture something meaningful about the dataset in relation to the research question.
The process works in six stages: familiarise yourself with the data, generate initial codes (labels for specific content that appears interesting), search for themes across codes, review and refine themes, define and name each theme clearly, and produce the analysis. For example, across 200 exit interview transcripts, thematic analysis might surface four dominant themes: lack of career progression, management quality, compensation gap, and culture misalignment — giving HR leadership a ranked view of attrition drivers that no rating scale could produce.
Content Analysis
Content analysis is more structured than thematic analysis. It involves systematically categorising qualitative content against a pre-defined framework, counting how frequently specific themes, words, or concepts appear. It bridges qualitative and quantitative approaches — turning descriptive data into frequency data that can be tracked over time.
In HR, content analysis is commonly applied to performance review language (how often does “communication” appear as a development area across a specific team?), job description audits (what skills language are competitors using that we are not?), and engagement survey open-ends (how has the frequency of “burnout” or “workload” language in comments changed over four quarters?).
Narrative Analysis
Narrative analysis focuses on the structure and arc of stories rather than just their content. In exit interviews or leadership assessments, the way someone tells their story — what they mention first, what they return to, how they frame cause and effect — carries as much meaning as the specific words they use.
This method is particularly valuable for understanding individual employee experiences and for identifying patterns in how specific managers or teams are discussed across different people’s narratives. It requires more analytical skill than thematic coding but produces a deeper understanding of the experiences driving engagement and attrition.
NLP and AI-Assisted Analysis
For organisations with large volumes of qualitative data, manual analysis becomes impractical. Natural language processing (NLP) tools can process thousands of open-ended survey responses, performance review comments, or job posting descriptions in minutes — extracting themes, sentiment, and skill signals at a scale no human analyst could match.
This is where platforms like JobsPikr add direct value to qualitative HR analytics: by applying NLP to millions of external job postings, they surface how the language of work is evolving across industries — what skills are being emphasised, what role titles are emerging, what language patterns signal a growing or shrinking demand category. When paired with internal qualitative data, this external signal layer is what transforms people analytics from a reporting function into a strategic intelligence function.
Choosing the right analysis method:
| Method | Best for | Scale | Skill required |
|---|---|---|---|
| Thematic analysis | Exit interviews, open surveys, focus groups | Small to medium (under 500 responses) | Moderate |
| Content analysis | Trend tracking, JD audits, performance reviews | Medium to large | Low to moderate |
| Narrative analysis | Individual cases, leadership assessment, culture diagnosis | Small | High |
| NLP / AI tools | Large-scale open-ended survey data, job posting analysis | Large to very large | Low (with right tools) |
The Integration Strategy: Making Qualitative + Quantitative Work
Real-World Example 1: The Cloud Skills Crisis
Qualitative signal: Exit interviews mentioning “career growth limitations” and “outdated technology stack”
Quantitative signal: Data showing 143.2% year-over-year growth in AI Engineer postings and 95.5% increase in Prompt Engineer roles
Combined insight: The problem isn’t internal management – it’s market evolution outpacing internal skill development
Action: Implement cloud certification programs and update technology stack to retain talent
Real-World Example 2: The Application Quality Mystery
Qualitative signal: Hiring managers reporting “declining candidate quality” and “skills mismatches”
Quantitative signal: Job posting analysis revealing 78% of similar roles now require data visualization skills (Power BI, Tableau)
Combined insight: Job descriptions haven’t evolved with market skill requirements
Action: Updated requirements resulted in 120% increase in qualified applications
Real-World Example 3: The Manager Quality Signal
Qualitative signal: One-on-one interview transcripts across a specific business unit showing consistent references to “unclear expectations,” “feeling micromanaged,” and “not knowing where I stand” — but only in three of seven teams within the unit
Quantitative signal: Attrition rate in those three teams running at 2.4× the company average, with tenure-at-exit averaging 14 months — well below the company norm of 26 months
Combined insight: The attrition was not driven by compensation, role scope, or external market pressure — the salary benchmarking data showed competitive positioning across all seven teams. The pattern was manager-specific, not function-specific. The qualitative data identified which managers, and the specific behaviours driving early departures.
Action taken: Targeted coaching intervention for the three managers identified, combined with a restructured onboarding programme that set clearer 30/60/90-day expectations. Attrition in those teams dropped significantly in the two subsequent quarters — a result that no engagement score or turnover metric alone would have produced, because neither would have identified the root cause with enough precision to act on.
Implementation Best Practices
Data Collection Strategy
Systematic approach:
- Standardize qualitative data collection across all sources
- Use consistent interview guides and survey formats
- Train managers on effective qualitative feedback techniques
- Implement regular review cycles for all qualitative inputs

Technology integration:
- NLP tools for processing open-ended responses at scale
- Real-time job market APIs for external signal integration
- Analytics platforms combining internal and external insights
- Visualization tools for presenting integrated findings
Analysis Framework
- Thematic analysis: Group qualitative insights into recurring themes. Look for patterns across different data sources and time periods.
- External correlation: Connect internal qualitative insights with job market signals. This validates internal observations and provides strategic context.
- Predictive modeling: Use combined qualitative and quantitative data for workforce forecasting. Organizations doing this effectively identify issues 2-3 months sooner than traditional HR cycles.
The Strategic Impact: Why This Matters Now
The organizations winning at people analytics aren’t just collecting more data – they’re combining the right types of data strategically.
Competitive advantages:
- Proactive planning: Spot workforce issues before they impact business outcomes
- Enhanced retention: Understand both internal experiences and external market pressures
- Strategic development: Align internal capabilities with market demand signals
- Market positioning: Use competitive intelligence to inform HR strategies
ROI reality: Early adopters of integrated people analytics see $13.01 ROI per dollar spent on workforce analytics. Organizations with mature analytics capabilities show 82% higher three-year average profit than their low-maturity counterparts.
Moving Forward: Your Next Steps
Start small but think strategically:
- Audit your current qualitative data sources: What employee voices are you already capturing but not analyzing systematically?
- Identify integration opportunities: Where could external job market signals provide context for internal patterns?
- Build analysis capabilities: Invest in tools and training for processing qualitative data at scale
- Create feedback loops: Use insights to improve both data collection and business outcomes
The future of HR analytics involves combining both qualitative and quantitative data to understand what’s happening in your organization, why it’s happening and what to do about it. When you can answer both the “what” and the “why,” you go from reporting to strategy. That’s where the real competitive advantage lives.
See how Jobspikr turns messy job data into strategy.
Schedule a quick demo to see sample dashboards, a normalized job dataset in action, and how qualitative signals integrate with market data.
FAQs
1. What do you mean qualitative data?
Feelings, opinions and experiences that are expressed in stories, and in other forms besides just words.
2. What is qualitative vs quantitative data?
Qualitative data is described in words and meaning as to the reasons things happen. Quantitative data is described in numbers as to the measurements and how much or how many.
3. Give five examples of qualitative data.
Comments that are left open ended, stories that are told in exit interviews, notes in the 1:1 interviews, transcripts in focus groups, and notes taken during observations.
4. Are interviews qualitative or quantitative?
They are mostly qualitative as stories and open ended questions are more dominant. They are quantitative in nature only when fixed ratings or numbers are applied.
5. What is one example of quantitative data?
The turnover rate for instance which is, 15 percent of engineers that left last year.