- **TL;DR**
- What Is Qualitative vs Quantitative Data in HR?
- Types of Data Every HR Team Should Know
- Want to turn workforce data into strategy?
- Internal vs External Data Sources: The Complete Picture
- Job Postings: The Ultimate Quantitative External Signal
- Employee Surveys: The Power of Qualitative Internal Data
- The Decision Framework: When to Use Each Type
- Combining Both Approaches: Real-World Examples
- Data Storytelling: When Numbers Need Narratives
- The Future of HR Analytics: Integration and Intelligence
- Making the Right Choice for Your Organization
- The Bottom Line: Context Is Everything
- Want to turn workforce data into strategy?
- FAQs
**TL;DR**
HR teams rely on both qualitative and quantitative data to make smarter people decisions. Quantitative data—like turnover rates and salary benchmarks—shows what is happening, while qualitative data—like employee feedback and exit interviews—explains why. The most effective HR strategies integrate both: numbers to track trends and narratives to provide context. By combining internal insights with external market intelligence, organizations can anticipate workforce changes, drive engagement, and build future-ready strategies.
HR teams today swim in an ocean of data. Employee satisfaction scores, hiring metrics, market trends, survey feedback, it’s everywhere. But here’s the challenge: not all data tells the same story, and knowing when to listen to numbers versus narratives can make or break your people strategy. The difference between qualitative vs quantitative data isn’t just academic. It’s the difference between understanding what is happening in your workforce and why it’s happening. It’s knowing when to trust the signals and when to dig deeper into the stories.
What Is Qualitative vs Quantitative Data in HR?
Let’s start with the basics.
Quantitative data is the numbers game – everything you can count, measure, and analyze with statistics. Think turnover rates, time-to-hire metrics, and salary benchmarks. Qualitative data lives in the realm of words, emotions, and experiences. It’s the “why” behind the numbers. Exit interview insights, employee feedback, and cultural observations all fall into this bucket.
Here’s where it gets interesting for HR professionals: both types of data are essential, but they serve completely different purposes in your decision-making process.
Types of Data Every HR Team Should Know
Understanding the landscape of HR data starts with recognizing the four fundamental measurement scales:
Nominal Data
- Categories without order: departments, job titles, gender
- Perfect for demographic analysis and workforce segmentation
Ordinal Data
- Categories with natural ranking: satisfaction levels, performance ratings
- Useful for understanding relative positions and preferences
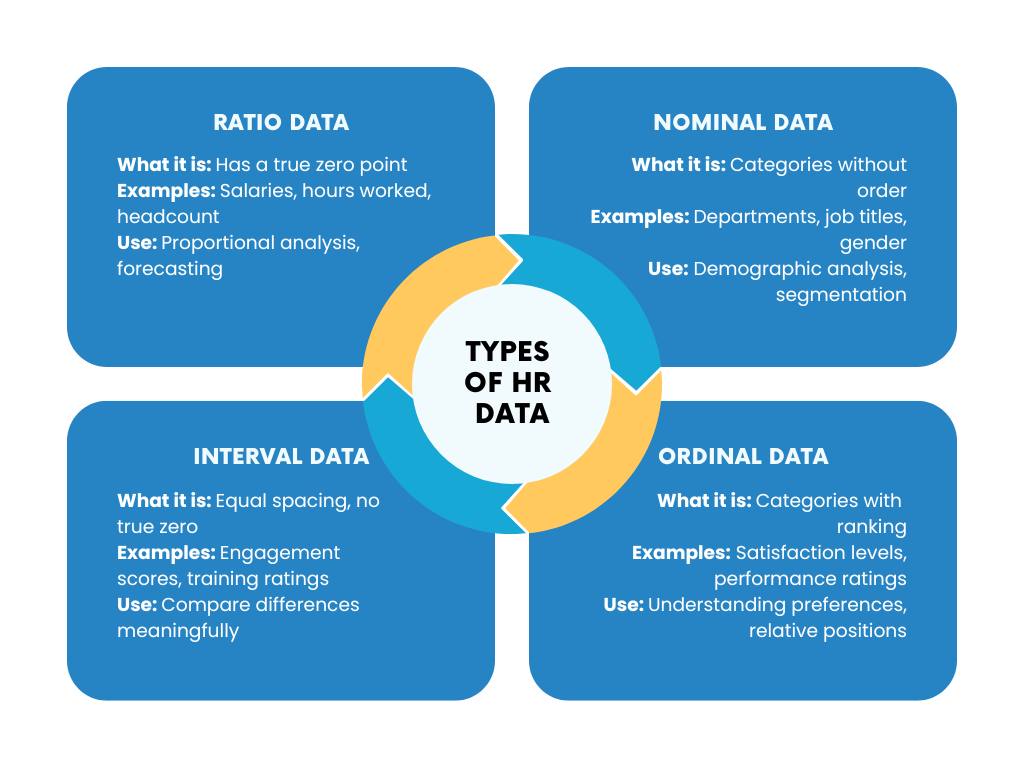
Interval Data
- Equal spacing between values: engagement scores, training ratings
- Enables meaningful comparison of differences
Ratio Data
- True zero point exists: salaries, hours worked, headcount
- Allows for proportional analysis and forecasting
Most HR teams work with a mix of all four, but knowing which type you’re dealing with determines how you can analyze and interpret your findings.
Want to turn workforce data into strategy?
Schedule a quick demo to see real-time job market signals and employee insights in action.
Internal vs External Data Sources: The Complete Picture
Your data strategy needs both internal insights and external market intelligence to be effective.
Internal Data Sources
Your HRIS, applicant tracking systems, and employee surveys generate massive amounts of internal data. This includes:
- Performance management records
- Learning and development tracking
- Payroll and compensation details
- Employee engagement survey results
- Demographic workforce information
Internal data tells you what’s happening inside your organization. It’s your company’s unique fingerprint in the talent landscape.
External Data Sources
External data provides the market context that internal metrics simply can’t offer:
- Industry salary benchmarking databases
- Labor market trend reports
- Government employment statistics
- Job market demand indicators
The most powerful external quantitative signal? Job posting data.
Job Postings: The Ultimate Quantitative External Signal
Job postings represent the largest standardized dataset about workforce demand globally. While your internal surveys tell you how employees feel, job posting trends reveal how the market moves. Consider this: JobsPikr processes 275 million job postings across 195 local contexts in real-time.
This creates an unprecedented view of:
- Hiring intensity patterns across industries and regions
- Skills demand evolution with 2-3 month lead time over internal HR cycles
- Compensation benchmarking based on actual market offers
- Geographic talent mapping showing where opportunities concentrate
The numbers tell a compelling story. AI Engineer positions grew 143.2% year-over-year, while Prompt Engineer roles expanded 95.5%. These aren’t just statistics – they’re signals about where your talent strategy needs to focus. Organizations leveraging labor market intelligence report being 2x more likely to improve both time-to-hire and quality-of-hire metrics. Companies using real-time wage data see up to 20% improvement in offer acceptance rates.
Employee Surveys: The Power of Qualitative Internal Data
While external job data provides market signals, employee surveys deliver the human story behind your workforce metrics.
Employee engagement surveys measure connection and commitment through both quantitative scores and qualitative feedback. The scores tell you what the engagement level is. The open-ended responses explain why.
Quantitative Survey Elements
- Job satisfaction ratings (1-10 scale)
- Intent to stay percentages
- Leadership effectiveness scores
- Work-life balance ratings
Qualitative Survey Insights
The real gold lies in the free-text responses:
- “I want better opportunities for professional development and training”
- “Better communication from upper management would help me feel more aligned with company goals”
- “I struggle to juggle childcare and work. Flexible hours would significantly improve my work-life balance”
These insights can’t be captured in numerical form, but they provide the context that transforms data into actionable strategy.
The Decision Framework: When to Use Each Type
Knowing when to lean on quantitative data vs qualitative data analysis requires understanding what each type does best.
When Quantitative Data Leads

Use quantitative data when you need to:
Validate Performance and Track Trends
- Measuring KPI progress over time
- Benchmarking against industry standards
- Identifying statistical patterns and correlations
Make Scalable Decisions
- Budget allocation across departments
- Workforce planning and forecasting
- Resource optimization strategies
Ensure Compliance and Accountability
- Meeting regulatory requirements
- Demonstrating ROI on HR initiatives
- Supporting data-driven business cases
When Qualitative Data Takes Center Stage
Turn to qualitative insights when you need to:
Understand the Human Experience
- Exploring employee motivations and concerns
- Assessing cultural alignment and values
- Identifying emotional drivers behind behaviors
Generate Hypotheses for Future Testing
- Discovering unexpected themes in feedback
- Understanding context behind quantitative trends
- Building empathy for employee perspectives
Drive Organizational Change
- Communicating vision and values
- Building buy-in for new initiatives
- Addressing resistance and concerns
Combining Both Approaches: Real-World Examples
The most successful HR strategies integrate both quantitative data vs qualitative data approaches.
Google’s Integrated Approach
Google combines quantitative engagement metrics with qualitative feedback through regular pulse surveys. They discovered that teams with high engagement scores achieve 21% greater profitability – but the qualitative feedback revealed how to replicate those conditions across other teams.
Adobe’s Transformation Story
Adobe replaced annual performance reviews with frequent check-ins, creating dynamic feedback loops that capture both numerical ratings and contextual conversations. The result? A 30% reduction in turnover supported by both improved metrics and employee stories about better manager relationships.
External Market Intelligence in Action
Smart organizations use job posting data to understand skill scarcity through multiple lenses:
- Quantitative analysis: Tracking certification requirements and technology stack demand
- Qualitative context: Understanding why certain skills command premium compensation
- Predictive insights: Identifying emerging roles before they become mainstream
When Machine Learning positions expanded 35.3% year-over-year, forward-thinking companies didn’t just see a number. They saw a signal to invest in ML training programs and adjust their recruitment strategies accordingly.
Data Storytelling: When Numbers Need Narratives
Data storytelling combines quantitative analysis with qualitative narrative to make insights actionable and memorable.
The framework includes three essential components:
Data Foundation
Solid quantitative analysis that reveals patterns, trends, and relationships in your workforce metrics.
Narrative Context
Qualitative insights that explain the “why” behind the numbers and provide recommendations for action.
Visual Communication Charts, graphs, and dashboards that make complex data accessible to stakeholders across the organization.
When Storytelling Matters Most
Use data storytelling approaches when you need to:
- Build empathy for employee experiences
- Drive organizational change initiatives
- Communicate cultural transformation needs
- Explain performance issues to leadership
- Justify strategic workforce investments
When Pure Signals Suffice
Rely on quantitative signals when you’re:
- Tracking routine performance metrics
- Making operational hiring decisions
- Benchmarking compensation packages
- Forecasting future workforce needs
- Measuring compliance and risk factors
The Future of HR Analytics: Integration and Intelligence
The HR analytics market is exploding. Valued at $3.08 billion in 2024, it’s projected to reach $8.59 billion by 2032. This growth reflects a fundamental shift in how organizations approach people decisions. But here’s what the numbers don’t tell you: the most successful companies aren’t choosing between qualitative vs quantitative data. They’re building integrated systems that leverage both.
Key Trends Shaping the Future
Skills Depreciation Acceleration
Skills now depreciate in less than 5 years, dropping to 2.5 years in technology sectors. This creates demand for real-time market intelligence that can identify emerging skills before they become critical gaps.
Predictive Workforce Analytics
Early adopters of workforce analytics achieve $13.01 ROI per dollar spent. The secret? Combining internal employee data with external market signals to predict trends rather than just react to them.
Strategic Workforce Planning Evolution
85% of companies are increasing investment in strategic workforce planning, but only 32% have adopted forecasting capabilities. The missing piece is often external market data that provides forward-looking context.
Making the Right Choice for Your Organization
The question isn’t whether qualitative or quantitative data is better. The question is which type serves your specific decision-making needs at any given moment.
Use this simple decision tree:
- If you need to understand WHAT is happening → Start with quantitative data If you need to understand WHY it’s happening → Focus on qualitative insights
- If you need to predict WHAT WILL happen → Combine both with external market signals If you need to influence HOW people respond → Lead with storytelling and qualitative narratives
Building Your Integrated Data Strategy
Start by auditing your current data sources:
- What internal quantitative metrics do you track consistently?
- Where are you gathering qualitative employee feedback?
- How are you incorporating external market intelligence?
- When do you combine different data types for decision-making?
The gap analysis will reveal where you need to strengthen your approach.
The Bottom Line: Context Is Everything
In the world of HR analytics, context transforms data into insight, and insight drives action. Your internal employee survey might show engagement scores dropping in the engineering department. That’s valuable quantitative data. The open-ended feedback reveals frustration with outdated technology and limited learning opportunities. That’s crucial qualitative context. But external job posting data showing a 143.2% increase in AI Engineer roles?
That’s the market signal that explains why your engineers are feeling restless and what you need to do about it. The most effective HR leaders don’t debate qualitative vs quantitative data. They orchestrate both types of insights to create comprehensive workforce strategies that respond to internal employee needs while anticipating external market changes. Whether you’re dealing with the human story of employee experience or the hard signals of market demand, the key is knowing when each type of data serves your decision-making process best.
The future belongs to organizations that master this balance – using storytelling to inspire their people and signals to guide their strategy.
Want to turn workforce data into strategy?
Schedule a quick demo to see real-time job market signals and employee insights in action.
FAQs
1. What is the difference between qualitative and quantitative data?
Qualitative data is descriptive and explains why something happens, often using words, opinions, or observations. Quantitative data is numerical and shows what is happening through counts, percentages, or measurements.
2. What are 5 examples of qualitative and quantitative data?
Qualitative examples: Employee feedback, interview transcripts, customer reviews, cultural observations, open-ended survey responses.
Quantitative examples: Salary figures, turnover rates, hours worked, test scores, number of hires per month.
3. Are interviews qualitative or quantitative?
Most interviews are qualitative because they focus on people’s experiences, feelings, and opinions. However, structured interviews with fixed-choice questions can also generate quantitative data.
4. Is age qualitative or quantitative?
Age is quantitative data because it can be measured in numbers, compared, and analyzed statistically (e.g., average age of employees).
5. What is an example of quantitative research?
A company survey that asks 1,000 employees to rate job satisfaction on a scale of 1–10 is quantitative research because it collects measurable data that can be compared and analyzed with statistics.