- **TL;DR**
- Calibrate Your KPIs: Industry Benchmarks That Reflect Today’s Market
- What Is Benchmarking in Business? (And What Happens When You Skip It)
- Types of Industry Benchmarks Ops Teams Use (And Why One Leaves the Rest Behind)
- Surveys vs. Signals: Why Static Benchmarks Fall Short
- Dynamic Benchmarking: How Real-Time Labor Market Analytics Change the Game
- Want to See Live Benchmarks for Your Roles?
- Industry Benchmark Scorecard: Static vs Live
- How HR Ops Teams Can Use Real-Time Benchmarks for Better Planning
- Live Benchmarks in Action: Real-World Use Cases
- Why JobsPikr Is a Smarter Choice for Industry Benchmarking
- See It in Action
- FAQs
**TL;DR**
If you’re still relying on last year’s survey to set this year’s KPIs, you’re already behind. Industry benchmarks have shifted from static reports to dynamic, role-level signals pulled directly from the labor market. While surveys give you a rear-view mirror, real-time job data gives you a GPS.
Traditional benchmarking in business meant downloading a report, comparing salary bands, and adjusting targets once a year. But markets move faster now, skills evolve monthly, remote work changes location premiums, and your competitors are hiring aggressively while you’re still validating headcount budgets.
Live industry benchmarks powered by external data sources like job postings offer a competitive baseline that’s not just accurate, it’s actionable. Use JobsPikr to watch the market like a live dashboard. You get current demand for roles, movement in pay ranges, and the skills that are rising. That feeds straight into workforce intelligence you can act on today, not next quarter.
Bottom line: real‑time benchmarking is no longer optional. It helps ops teams set targets they can hit, guard budgets against surprise swings, and stay a step ahead of competitors.
Calibrate Your KPIs: Industry Benchmarks That Reflect Today’s Market
Benchmarks are only useful if they match the reality you’re operating in. If your team is setting targets off last year’s survey tables, you’re not calibrating, you’re guessing. Industry benchmarks should help you answer practical questions in plain terms: are our salary bands competitive in the cities where we hire, how fast are roles like data engineer or merchandiser moving right now, and what does “good” look like for time‑to‑fill, offer acceptance, or training ramp?
The challenge is speed. Markets don’t wait for the next annual report. Pay premiums shift with new skill demand, hybrid policies alter location weightings, and entire role families appear or fade in a matter of months. When the baseline is moving this quickly, static comparisons turn into false confidence. You need a view that reflects today’s market, not last winter’s.
This is where live industry benchmarks earn their keep. Instead of a snapshot, you get a feed: current salary ranges by role and location, the volume of open requisitions across competitors, and the skills tagged in those postings. That blend of signals turns into workforce intelligence your operations team can actually use, KPI target setting that mirrors reality, not wishful thinking.
It also changes how you plan. A company that sees offer ranges climbing for cloud security specialists in Bangalore can adjust compensation bands this quarter, not next year. A retailer that spots a spike in seasonal hiring velocity in Pune can open requisitions earlier and add sourcing channels before the rush. These aren’t abstract insights; they’re live benchmarks that tighten decisions on budget, timing, and mix.
Most importantly, the right approach keeps you honest. If your “industry benchmarks” don’t change when the market does, they’re not benchmarks. They’re placeholders. Modern planning pairs internal performance with external labor market analytics so your KPIs stay aligned with the competitive baseline, week after week, not once a year.
What Is Benchmarking in Business? (And What Happens When You Skip It)
Let’s say your team just rolled out a new hiring plan. You’ve got timelines, salary bands, and application targets locked in. But here’s the question, locked in compared to what?
That’s the entire point of benchmarking. You don’t just want goals; you want grounded goals. In business, benchmarking means stacking your performance next to a real-world reference point. Not your best guess. Not last year’s plan. A true external baseline.
And without it? You’re doing operations in a vacuum. That new 60-day hiring target might sound efficient until you learn your top three competitors are filling the same role in 32. Your “competitive” salary for cloud engineers might be 15% below market. Your training program might be spending twice the time to reach the same outcomes that others get in half.
That gap between thinking you’re doing well and actually staying competitive? That’s where benchmarking fits in.
Ops teams use it for:
- Salary benchmarking: Are we paying at market level, or just hoping our brand covers the gap?
- Hiring benchmarks: How long should it take to close a role like this?
- Performance targets: Are our ramp-up timelines realistic, or disconnected from how other teams work?
The deeper truth is this: internal metrics only get you halfway. Benchmarking completes the picture by putting your KPIs in context. That’s why every planning cycle headcount, comp, L&D, and even retention should start with an honest look at where you stand in the market.
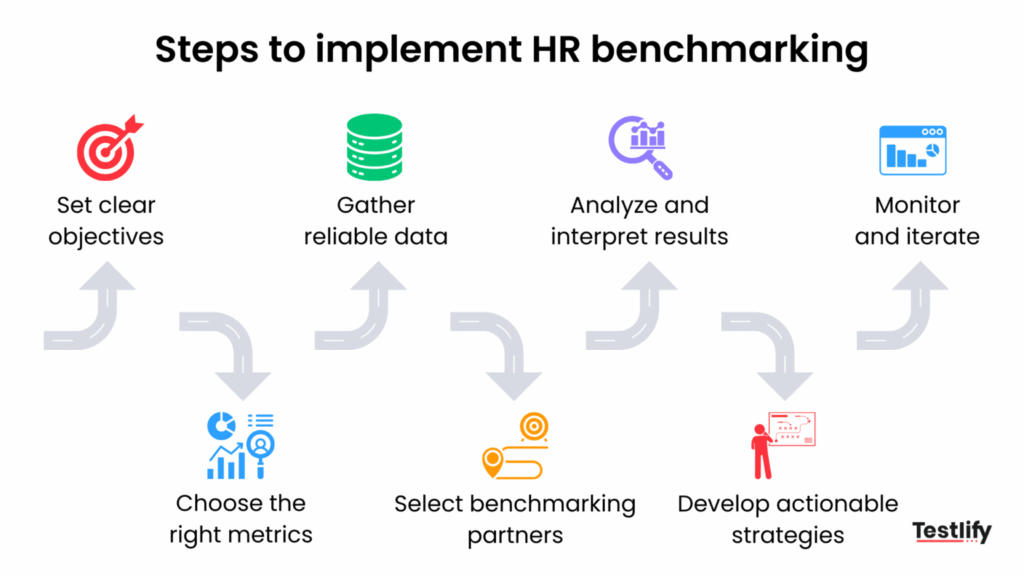
Image Source: testlify
And yes, there’s more than one way to benchmark. Up next: the three main types ops teams rely on (and why only one of them actually keeps up with the speed of hiring today).
Types of Industry Benchmarks Ops Teams Use (And Why One Leaves the Rest Behind)
Here’s where most ops teams get tripped up. They hear “benchmark” and think it’s all the same, some neatly packaged data point you plug into a deck. But not all benchmarks are built equal. In fact, the kind you use can say a lot about how fast or how slow your decisions will be.
Let’s break down the three most common types.
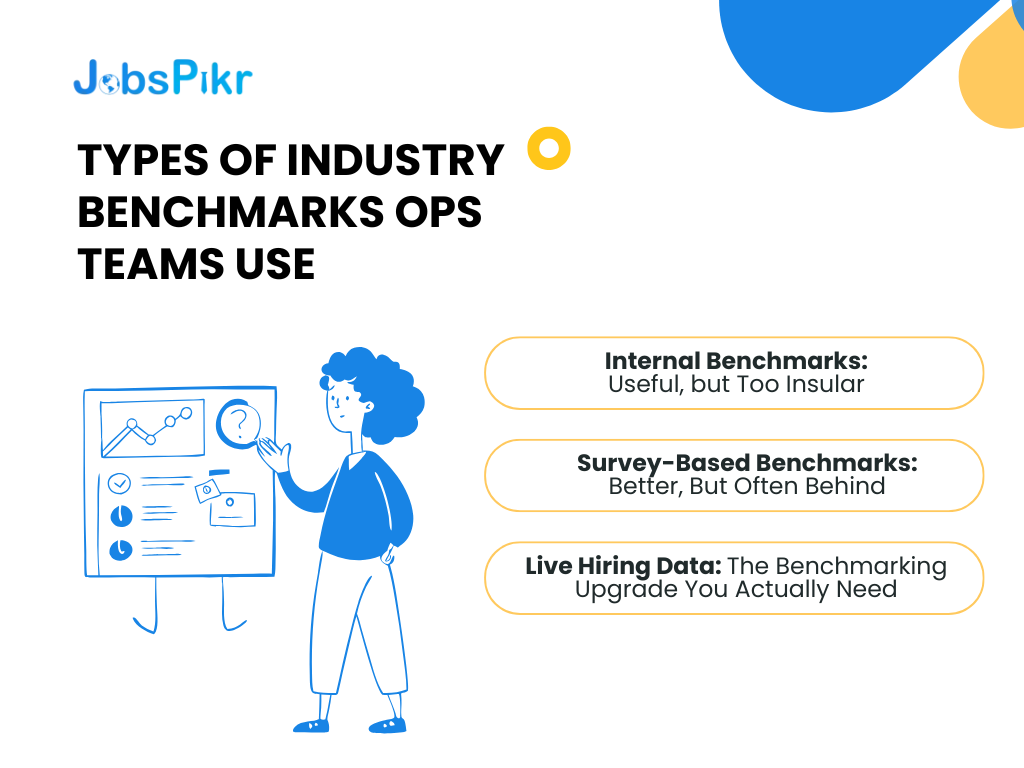
1. Internal Benchmarks: Useful, but Too Insular
These are built from your own data. Time-to-fill based on your last three quarters. Average onboarding time from your past five cohorts. Promotion cycles are tracked internally.
And these matter. They help you see whether you’re improving over time. But they also trap you inside your own bubble. Just because your sales team ramped in 45 days last year doesn’t mean that’s still good enough if everyone else is hitting 30 now.
Use them for: trend tracking and internal consistency
Don’t use them for: market comparisons or competitive calibration
2. Survey-Based Benchmarks: Better, But Often Behind
This is the classic move: download a big benchmarking report. It’s usually based on annual or quarterly surveys, broken down by region, industry, and maybe company size.
And yes, there’s value here. You get a sense of what others are reporting, average salaries, hiring patterns, and turnover rates. But you’re also dealing with major limitations:
- Time lag: By the time it hits your inbox, the data’s already months old.
- Response bias: The data depends on who bothered to answer.
- Lack of specificity: You want granular insights by role, location, and skill. These reports usually give you broad averages.
It’s like using a rearview mirror to steer.
3. Live Hiring Data: The Benchmarking Upgrade You Actually Need
This is the shift. Live benchmarks don’t wait for surveys they pull real-time signals from job postings, salary bands, hiring velocity, and skills in demand. Instead of relying on someone’s answer to a questionnaire, you’re watching actual employer behavior as it unfolds.
So, if the market starts paying 12% more for AI product managers in Mumbai this month? You’ll see it. If your competitors double their open roles in logistics ahead of Q4? That spike shows up.
This isn’t just benchmarking, it’s workforce intelligence. It helps you react faster, budget better, and set KPIs that reflect reality, not assumptions.
If you’re using a salary benchmarking tool built on this kind of data (like what JobsPikr provides), you’re not estimating anymore. You’re making decisions with context.
Surveys vs. Signals: Why Static Benchmarks Fall Short
Most benchmark surveys look great in a boardroom, but they break down fast in the real world. Why? Because by the time you get that glossy PDF, the market has already moved.
Here’s how it usually plays out.
You’re planning headcount for Q2. You flip to page 47 of the latest industry salary survey. It says data analysts in Tier 1 cities earn ₹11.2L on average. Sounds solid. You plug that into your model and start drafting your job offers.
But here’s what you didn’t see.
Since that survey was collected six months ago, three major firms have expanded their analytics teams. Remote flexibility brought Tier 1 salaries into Tier 2 cities. And the moment ChatGPT 5 hit the market, demand for prompt engineers cannibalized traditional analyst roles. The ₹11.2L figure? It’s now low by at least 15%.
The survey gave you history. What you needed was a signal.
Static Benchmarks Miss the Moment
Here’s what traditional benchmarks can’t do:
- React to sudden market shifts. Economic slowdown, funding freezes, or tech booms don’t wait for survey cycles.
- Track hiring velocity. Surveys might tell you the average time-to-fill across industries. They won’t show you how fast your competitors are scaling today.
- Spot skill demand surges. If AI tools suddenly spike demand for “vector database” experience, real-time job data catches that. Surveys won’t be until next year.
It’s not that surveys are wrong. They’re just not built for speed. They’re designed for quarterly reviews, not weekly standups.
What Signals Do That Surveys Can’t
Let’s flip it.
You use a workforce intelligence platform that tracks live job postings across your market. For e.g., you see:
- A 23% jump in listings that mention “composable commerce” in the past two weeks
- Average offer ranges for growth marketers are climbing ₹2.5L in Delhi NCR since Q1
- Hiring slowdowns in competitor X after their product pivot
These aren’t gut feelings. They’re benchmarks, but dynamic ones. And they let you respond before the trend becomes a problem.
This is the shift JobsPikr enables. It doesn’t just give you data, it gives you timing. And in ops, timing is everything.
Dynamic Benchmarking: How Real-Time Labor Market Analytics Change the Game
Traditional benchmarking is like checking the weather in yesterday’s newspaper. You’ll get an answer, but it’s not going to help you decide what to wear today.
Dynamic benchmarking flips that completely. Instead of waiting for reports, you track the market as it moves. You don’t rely on averages; you respond to signals. This is what labor market analytics tools like JobsPikr are built for.
So, What Makes It “Dynamic”?
Live industry benchmarks pull in external data points, job postings, salary mentions, skill tags, hiring timelines and refresh them constantly. You’re not working off last quarter’s summaries. You’re looking at what just happened this week.
That means:
- Salary bands reflect current competition, not outdated estimates
- Role descriptions reveal what skills companies are prioritizing now
- Hiring volumes signal strategic shifts in your market or niche
This isn’t abstract data. It’s tactical fuel for ops teams.
Real-Time Benchmarks Support Strategic Moves Like:

1. Updating Salary Bands
Say you’re planning compensation for data engineers in Chennai. The survey from six months ago lists ₹16.5L as the median. But JobsPikr shows the actual median this week is ₹18.2L across 37 live postings.
Suddenly, your offers look underwhelming. You don’t waste a month wondering why candidates ghosted you. You fix it before that happens.
2. Tracking Competitor Velocity
You’re running lean, trying to hire responsibly. Then you see that your closest rival just opened 45 product roles in under two weeks, all tagged with “GenAI”. You realize they’re shifting fast. That’s a signal. Whether you react by accelerating or pivoting, you’re not caught flat-footed.
3. Forecasting Skill Trends
Planning L&D or certification paths? Don’t base it on intuition. Use job market analytics to spot real demand surges, like a 34% spike in postings requiring “cyber threat modeling” or “LLM fine-tuning”.
Now your training budget is tied to growth, not guesswork.
Where Ops Teams Gain the Edge
With dynamic benchmarking, you don’t just see what’s happening, you translate it into action:
- Salary benchmarking tools stay aligned with market pressure
- Competitive baselines get adjusted in real time
- KPIs reflect actual role performance, not outdated norms
You go from reacting late to planning ahead. From spreadsheet decisions to signal-led strategies.
Want to See Live Benchmarks for Your Roles?
Book a demo and explore how JobsPikr’s real-time labor market insights help teams set smarter KPIs, monitor competitors, and adapt faster than the market shifts.
Industry Benchmark Scorecard: Static vs Live
If you’re still debating whether live data is just a nice-to-have, let’s settle it with a straight-up comparison. Static benchmarks (think: annual surveys and generic PDFs) serve a purpose, but they can’t compete with the responsiveness and granularity that live labor market data brings to the table.
Here’s the scorecard:
| Feature | Survey-Based Benchmarks | Live Hiring Data (via JobsPikr) |
| Update Frequency | Annually or Quarterly | Daily, Weekly, or Real-Time |
| Data Source | Self-reported surveys | Actual job listings & market signals |
| Role Specificity | Broad categories | Role + Location + Skill-Level Precision |
| Geographic Accuracy | Regional averages | City and Zip-Level Precision |
| Customization | Limited | Fully Tailored to Company Needs |
| Hiring Velocity Tracking | Not Available | Yes – Tracked in Real Time |
| Skill Demand Trends | Lagging | Dynamic, Signal-Based |
| Bias Risk | High (depends on who responds) | Low (based on public postings) |
| Use in KPI Target Setting | Weak, often outdated | Strong, updated weekly or better |
| Value for Strategic Planning | Limited to hindsight | Future-facing and actionable |
The takeaway? Surveys offer a snapshot. Live hiring data offers a feed. One shows what happened. The other shows what’s happening.
In a world where salary trends can shift in two months and competitor moves happen overnight, ops teams can’t afford to use benchmarks that lag. If you’re making planning decisions on old inputs, your outcomes will always trail the market.
Dynamic benchmarking isn’t just more accurate, it’s more alive.
How HR Ops Teams Can Use Real-Time Benchmarks for Better Planning
Having live benchmarks is powerful, but only if you know how to use them. This is where ops and planning teams can move from insight to impact.
Let’s walk through how real-time labor market analytics change the game at every stage of workforce planning.
Set Salary Bands That Actually Work
You don’t want to lose top candidates because your salary range is 8% off-market. But you also don’t want to overpay out of fear. Real-time salary benchmarking tools give you up-to-date ranges for specific roles, skills, and cities, not just broad industry averages.
Let’s say you’re hiring data analysts across Bangalore and Pune. JobsPikr shows a ₹3L gap in median offers between the two cities for the same role. That’s not something a yearly comp survey would flag. But with live data, you adjust your offers immediately and stay competitive without guessing.
Track Hiring Velocity to Avoid Bottlenecks
If you know how fast others are hiring for a given role, you can adjust your timelines and sourcing strategies accordingly. For example, let’s say JobsPikr shows the average time-to-fill for full-stack engineers has dropped from 41 days to 28 days over the past month in your region.
That’s your cue to move faster. You may need to streamline interviews or add sourcing bandwidth, because the market won’t wait for your old processes.
Monitor Competitor Demand (Before It Hits You)
Imagine you’re a logistics company planning seasonal hiring. Live job data shows your top three competitors have already started ramping up warehouse hiring—four weeks earlier than last year.
That’s your trigger. If you wait, you’re competing for the same talent in a tighter window. With dynamic industry benchmarks, you don’t just see what’s happening, you see it early enough to act.
Respond to Skill Demand Shifts in Real Time
You don’t want to build training programs based on skills that were hot last year. With live data, you can track which certifications, tools, or technologies are suddenly appearing in job posts.
Maybe your learning & development budget was aimed at Tableau, but JobsPikr shows Power BI mentions outpacing Tableau 3:1 in your target industry. That’s a strategic pivot you can make before falling behind.
Adjust Workforce Planning by Location
Hybrid work and remote-first policies have changed the salary landscape. Live benchmarks let you fine-tune comp based on where the talent pool is, not just where your office is.
For example, if you’re expanding into Tier 2 cities, you’ll want to compare current salary trends there, not rely on blanket national numbers. JobsPikr gives you that location-specific precision.
Calibrate KPIs With Confidence
You can’t hit a target that’s already outdated. Dynamic benchmarks let you recalibrate KPIs for things like:
- Time-to-hire
- Offer-to-acceptance rates
- Ramp-up time
- Cost-per-hire
Instead of comparing your metrics to a generic industry average, you compare them to live market performance. That’s what makes KPI target setting realistic, not aspirational.
Live Benchmarks in Action: Real-World Use Cases
Let’s get out of theory and into the field. Here’s how real teams have used live industry benchmarks, not static reports, to make sharper, faster planning decisions.
Each one highlights how real-time labor market analytics helped ops teams stay ahead instead of playing catch-up.
Use Case 1: A Fast-Scaling Fintech That Fixed Its Salary Bands Before Losing Candidates
A growing fintech startup in Mumbai was struggling to hire backend developers. Their interview process was clean. Their culture was strong. But candidates kept dropping out after the offer stage.
Using JobsPikr, their ops team checked current salary benchmarks across similar companies in the region and saw something their comp survey hadn’t caught.
Median salary bands had jumped 12% in under 90 days, thanks to a burst of VC-backed hiring across three rivals. The company was under-offering without even realizing it.
They adjusted their bands mid-cycle, closed two critical roles within the next month, and used live salary tracking to avoid falling behind again.
Without live benchmarks, they would’ve blamed the wrong thing.
Use Case 2: A Retail Chain That Saw Seasonal Hiring Shifts Early
A national retail chain typically began holiday-season hiring in mid-October. But using real-time hiring velocity data, the team noticed something strange in August:
Their two biggest competitors had already started ramping up headcount. JobsPikr showed spikes in warehouse, delivery, and customer service postings in key metros—four to six weeks ahead of last year’s trend.
They fast-tracked approvals and activated local agency partners early. The result? They staffed up faster, spent less on last-minute talent, and avoided being left behind.
This wasn’t insight from a report. It was a live signal that triggered action.
Use Case 3: A Tech Firm That Pivoted Its Upskilling Strategy on Time
A mid-sized SaaS company wanted to invest in upskilling—but didn’t know which skills would actually drive future competitiveness.
They turned to JobsPikr’s skill trend tracking, which analyzes job descriptions for in-demand certifications and tools.
They spotted a 26% month-over-month rise in job listings requiring “vector databases” and “LangChain” experience—signs that GenAI infrastructure was becoming table stakes.
They revamped their internal training focus to cover RAG systems and prompt optimization, reallocating budget from less urgent L&D tracks.
Result: their teams stayed ahead of market trends instead of reacting too late.
These aren’t edge cases. They’re the new baseline for planning teams that use dynamic benchmarks. With tools like JobsPikr, you don’t just get smarter after the fact, you get faster before it happens.
Why JobsPikr Is a Smarter Choice for Industry Benchmarking
Most benchmarking tools give you numbers. JobsPikr gives you a window into the market, not just averages and charts, but live hiring activity, skill shifts, and salary movements pulled directly from job listings across the globe.
Here’s why ops teams choose JobsPikr when they’re done playing guessing games with stale data.
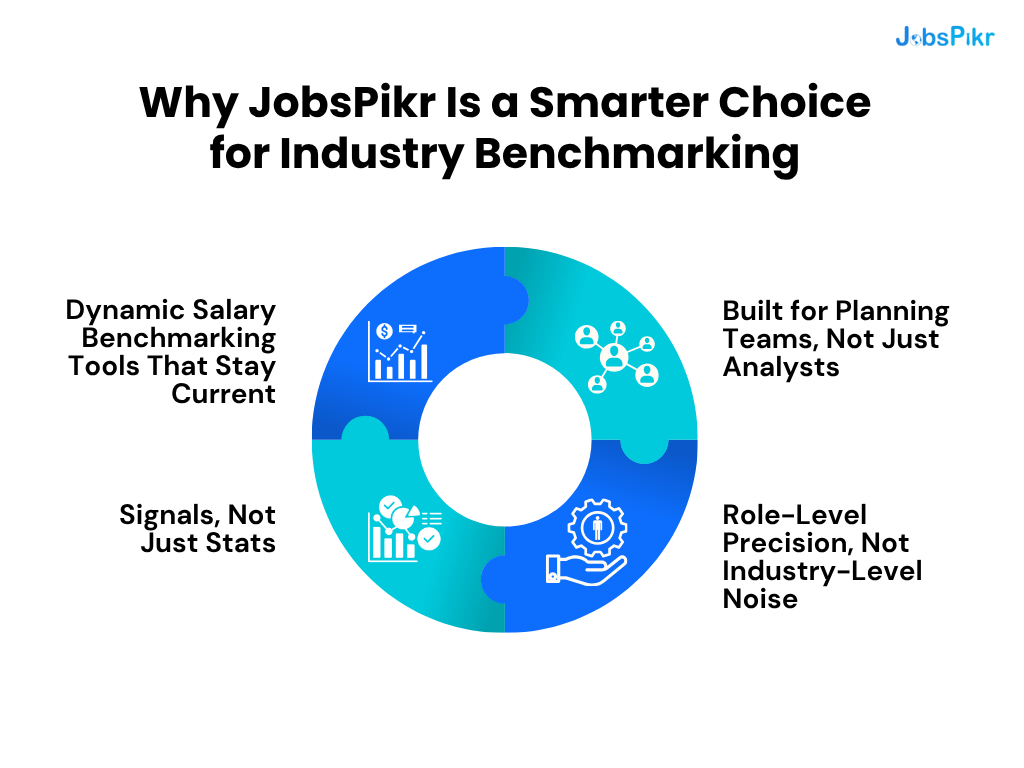
Built for Planning Teams, Not Just Analysts
Most platforms flood you with dashboards. JobsPikr delivers operationally relevant insights, benchmarks you can actually plug into workforce planning models, comp reviews, and KPI setting.
You don’t need to be a data scientist to use it. But if you are? You’ll love the granularity.
Role-Level Precision, Not Industry-Level Noise
“Marketing Manager” isn’t just one job anymore. Some require ad ops. Some want data chops. Others care more about content strategy.
JobsPikr doesn’t lump them into generic categories. It breaks roles down by:
- Title variants
- Location-level salary bands
- Skill tags
- Seniority and demand trends
That means you’re benchmarking the actual role you’re hiring for—not a washed-out industry average from last year.
Dynamic Salary Benchmarking Tools That Stay Current
Say goodbye to spreadsheets that age like milk. JobsPikr tracks salary mentions across thousands of live postings and lets you slice the data:
- By role and location
- By industry vertical
- Over time (month-on-month comparisons)
The result? You always know where your offers stand before the candidate tells you.
Signals, Not Just Stats
Need to know if your competitor is staffing up fast? JobsPikr shows open job count spikes.
Want to know if a new skill is emerging across your sector? JobsPikr shows sudden demand surges based on skill mentions.
This is more than benchmarking. This is workforce intelligence, and it’s what separates good ops teams from great ones.
See It in Action
Schedule a walkthrough to see how JobsPikr helps ops teams turn live labor data into salary bands, hiring forecasts, and planning decisions.
FAQs
1) What are industry benchmarks, really?
They’re reference points you use to see where you stand: pay ranges, time‑to‑hire, offer acceptance, and ramp time. Good industry benchmarks give you a competitive baseline, so KPI target setting isn’t guesswork. Great ones reflect today’s market, not last quarter’s snapshot.
2) What is benchmarking in business, and why does it matter for ops?
Benchmarking in business means comparing your results with a standard you trust. For ops and planning teams, it’s how you decide if salary bands are competitive, hiring timelines are realistic, and budgets are grounded. Without it, you’re building plans in isolation.
3) How are live benchmarks different from survey reports?
Survey-based benchmarks are static and often dated by the time you use them. Live benchmarks come from real hiring signals, job postings, salary mentions, and skills in demand—so they change as the market changes. If you need to react fast, live data beats PDFs every time.
4) What does a salary benchmarking tool help me do?
It shows current pay ranges by role, location, and skill, so it offers a landing in the right band the first time. Pair it with labor market analytics, and you also see hiring velocity and demand spikes. That mix helps you protect budgets and still win candidates.
5) Why bring labor market analytics into workforce planning?
Because it turns benchmarks into actions. You can see when competitors ramp up, when a skill premium appears, or when time‑to‑fill drops in a city you hire in. Those signals feed workforce intelligence better timing, better comp decisions, and fewer surprises in your plan.