- **TL;DR**
- How an Insights Engine Differs from a Dashboard or A Data Feed
- Turn job market data into decisions you can stand behind
- How JobsPikr Collects Job Market Data While Protecting Trust and Traceability
- How Data Transformation Turns Messy Postings into Analysis-Ready Job Market Data
- Turn job market data into decisions you can stand behind
- How Enrichment Adds Meaning to Normalized Job Postings
- How the Labor Analytics Engine Converts Signals into Decisions Teams Can Defend
- Turn job market data into decisions you can stand behind
- What Decisions HR Tech and Analytics Teams Can Support with Job Data Analytics
- How Data Visualization Makes Labor Analytics Easier to Act On
- How JobsPikr Maintains Quality so the Insights Engine Stays Trustworthy Over Time
- Turn job market data into decisions you can stand behind
- How to Evaluate an Insights Engine Before You Commit to a Labor Analytics Platform
- How to Start with JobsPikr Without Overbuilding Your Labor Analytics workflow
- Turn job market data into decisions you can stand behind
- FAQs:
**TL;DR**
Most job market data start out noisy, fragmented, and hard to trust. Titles mean different things across companies, locations are inconsistent, and raw volumes rarely explain why hiring patterns change. The JobsPikr insights engine exists to bridge that gap. It takes raw job market data and runs it through a structured labor analytics engine that cleans, enriches, and connects signals so teams can move from observation to decision with confidence.
Key takeaways
- Raw job postings are not insights. Without data transformation and validation, job data analytics can easily mislead rather than inform.
- An insights engine goes beyond dashboards by linking roles, skills, companies, locations, and time into a single, explainable view of the labor market.
- JobsPikr’s labor analytics engine focuses on trust, transparency, and context, helping HR tech and analytics teams work with job market data they can rely on.
- The real value of labor analytics shows up when insights are consistent, comparable, and ready to support workforce planning decisions.
JobsPikr’s insights engine is basically the step most teams are missing between “we have a lot of job postings” and “we know what to do with them.” It cleans up the messy parts, adds the missing context, and makes the patterns usable, so your labor analytics and job data analytics aren’t built on shaky assumptions. The result is job market data you can use for decisions, not just a dashboard you glance at and ignore.
Why Raw Job Market Data Rarely Answers the Workforce Questions You Have
If you have ever pulled a large set of job postings and expected clear answers to fall out of it, you already know the disappointment. On the surface, job market data looks rich. There are titles, descriptions, locations, companies, and dates. Most of that data is inconsistent, repetitive, and full of gaps. Without the right structure, raw postings create more confusion than clarity, especially when teams try to use them for labor analytics or workforce planning.
Raw job postings carry predictable noise
Job postings are written for candidates, not for analysis. Every company describes roles differently, uses its own naming conventions, and updates postings on its own schedule. When this data is collected at scale, those inconsistencies compound quickly. What looks like a hiring surge might simply be a formatting issue or a posting habit, not a real shift in demand.
Teams new to job data analytics often assume volume equals insight. It does not. Noise is baked into job market data, and unless you expect it and design for it, your analysis will drift away from reality.
Duplicate and reposted roles inflate demand signals
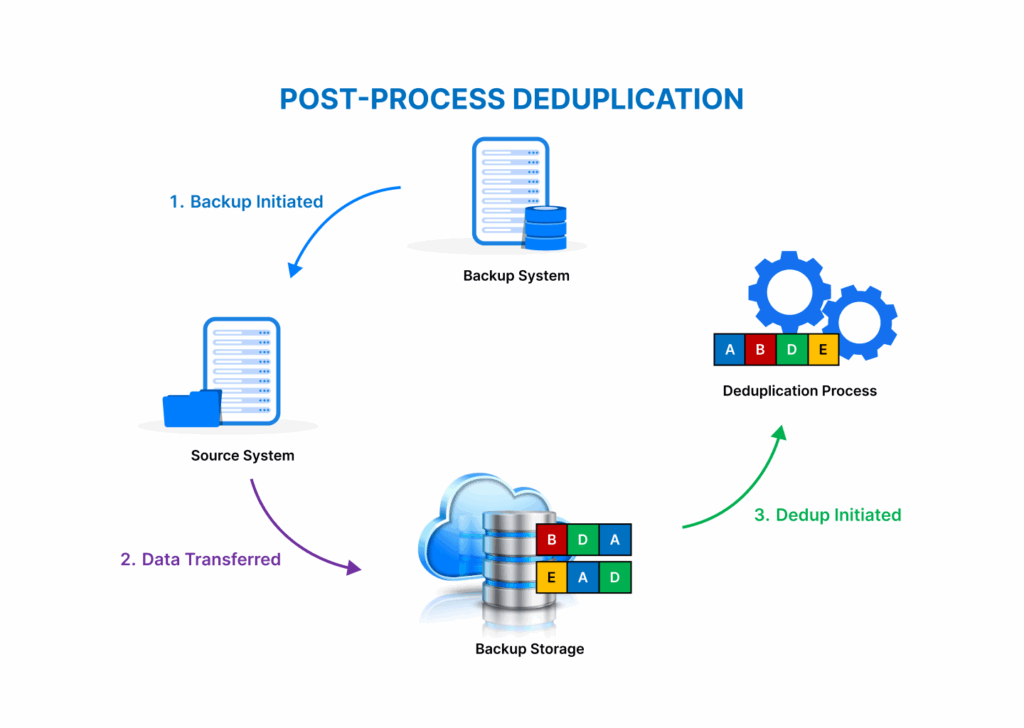
One of the most common problems in raw job market data is duplication. Companies frequently repost the same role to refresh visibility or publish identical openings across multiple platforms. If these duplicates are not handled correctly, labor analytics engines can end up reporting demand that does not actually exist.
Duplicate detection as a baseline quality gate
Duplicate detection is not an advanced feature. It is table stakes. Without it, even simple counts become unreliable. Two postings can look different on the surface while representing the same opening underneath.
Reposted jobs distort time-based trends
Reposting resets timestamps. If your system treats reposts as new demand, trend lines start showing artificial spikes. Over time, this leads teams to believe hiring demand is growing or shrinking when it is actually flat.
Cross-platform duplication multiplies false volume
The same role may appear on a company career page, two job boards, and a regional site. Without cross-source reconciliation, job data analytics systems often count each appearance as a separate role.
Why inflated demand leads to bad decisions
When demand looks higher than it really is, teams may overinvest in sourcing, misjudge competition, or misread labor shortages. Decisions based on inflated signals are hard to defend once reality catches up.
Location and title inconsistencies break comparisons
Even when duplicates are removed, raw job market data still struggles with comparability. Titles and locations are rarely standardized, which makes side-by-side analysis risky. A “Software Engineer II” in one company may be a “Backend Developer” in another, even though the work is nearly identical.
Title variation hides role similarity
Creative titles like “Platform Ninja” or “Growth Hacker” might attract candidates, but they fragment analytics. Without title normalization, job data analytics treats similar roles as unrelated categories.
Location formatting masks geographic patterns
Locations can appear as cities, regions, remote tags, or hybrid descriptions. If these are not normalized, geographic labor analytics becomes inconsistent and misleading.
Remote and hybrid roles complicate market signals
A role marked “Remote – US” behaves very differently from a role tied to a single metro. Mixing these without clear labeling blurs geographic demand patterns.
Why broken comparisons undermine labor analytics
Labor analytics depends on comparison. When titles and locations are not aligned, benchmarks collapse. Teams may think they are comparing markets or roles when they are comparing formatting choices.
How an Insights Engine Differs from a Dashboard or A Data Feed
Most teams start their labor analytics journey in one of two places. Either they buy access to a large job data feed, or they build dashboards on top of whatever data they can collect. Both approaches feel productive at first. You have data coming in. You have charts updating. But neither guarantees that the numbers mean what you think they mean.
This is where the idea of an insights engine becomes important. It is not a prettier dashboard, and it is not just a bigger dataset. It is the layer that makes job market data usable for decisions.
| Layer | What it typically provides | Where it falls short for labor analytics |
| Job data feed | Raw access to job postings and metadata | Lacks context, comparability, and validation, leaving analytics teams to fix inconsistencies themselves |
| Dashboard | Visual summaries of counts and trends | Reflects data quality issues without resolving them, which can lead to conflicting interpretations |
| Insights engine | Connected, validated labor market signals | Designed to support decisions by transforming job market data before analysis and visualization |
An insights engine connects signals instead of listing metrics
A data feed gives you rows and columns. A dashboard gives you counts and trends. An insights engine focuses on relationships.
In labor analytics, very few questions can be answered by a single metric. Hiring demand only makes sense when viewed alongside skills, locations, companies, and time. An insights engine is designed to connect those dimensions, so patterns emerge naturally. For example, it helps you see not just that postings for a role are increasing, but where that increase is happening, which skills are being emphasized, and which types of employers are driving the change.
This connected view is what turns job data analytics into something teams can reason about instead of reacting to.
A dashboard visualizes data but does not fix its meaning
Dashboards are useful, but they inherit all the problems of the data underneath them. If titles are inconsistent, locations are messy, or duplicates are present, the dashboard simply visualizes those flaws at scale.
This is why many labor analytics dashboards look impressive but fail under scrutiny. Two stakeholders ask the same question and walk away with different interpretations. The issue is not the chart. It is that the system behind it never resolved what the data represents.
An insights engine does that work before anything is visualized. By the time data reaches a dashboard, the heavy lifting has already happened.
A data feed provides access but not decision context
Access to job market data is not the same as understanding the job market. A feed tells you what was posted. It does not tell you what changed, what matters, or what is comparable.
Analytics teams often spend months building logic around raw feeds just to answer basic questions reliably. That effort is usually invisible, repetitive, and fragile. Every new use case requires another layer of assumptions.
An insights engine bakes that context in from the start. It applies consistent rules for transformation, enrichment, and validation so insights hold up across teams, time periods, and markets. That consistency is what builds trust in labor analytics outputs.
In simple terms, dashboards show you data, feeds give you access, but an insights engine gives you confidence that the story you are seeing is grounded in reality.
Turn job market data into decisions you can stand behind
If you are tired of second-guessing charts and want labor analytics that holds up in real planning conversations, it starts with the right insights engine.
How JobsPikr Collects Job Market Data While Protecting Trust and Traceability
Before any transformation or analysis can happen, there is a more basic question that needs answering: where does the data come from, and can you trust it over time? For labor analytics to hold up in real decision-making, data collection must be deliberate, ethical, and designed for repeatability. This is the part of the pipeline most people never see, yet it shapes everything that follows.
JobsPikr approaches job market data collection with the assumption that analytics teams will eventually need to explain their numbers. That means every data point must be traceable, consistent, and defensible, not just available.
Source governance shapes the reliability of labor analytics
Not all job postings are equal. Some are updated regularly, some are abandoned, and some are syndicated so widely that they create more noise than signal. Source governance is about deciding what enters the system and under what conditions.
JobsPikr focuses on sources that publish structured, publicly available job postings and exhibit stable posting behavior over time. This reduces the risk of sudden data gaps, inconsistent schemas, or sudden shifts caused by platform-level changes. For labor analytics teams, this matters because trends only make sense when the underlying sources behave predictably.
A 2023 report from the OECD highlights that online job postings are increasingly used as a proxy for labor demand but also warns that coverage and source consistency directly affect interpretation accuracy. That caution is exactly why source governance is treated as a first-class concern in the insights engine.
Field-level capture creates a stable base for job data analytics
Collecting job postings is not just about grabbing text. It is about capturing the right fields in a way that supports downstream analysis.
JobsPikr captures core job attributes such as title, description, company, location, posting date, and application URL, along with supporting metadata needed for analytics. Each posting is treated as a time-bound record, not a static snapshot. This allows job data analytics to account
Timestamping and versioning enable historical truth
Every posting is timestamped when first seen and tracked when changes occur. If a description is updated or a role is reposted, those changes are recorded rather than overwritten.
This versioning approach is critical for labor analytics because it preserves historical truth. Analysts can distinguish between genuinely new demand and recycled postings, and they can study how job requirements evolve over time instead of relying on a single frozen view.
Consistent schemas reduce downstream rework
By enforcing consistent field definitions early, the insights engine prevents schema drift later. Analytics teams do not need to constantly re-map fields or reinterpret meanings as new data arrives.
Structured capture supports scale without fragility
When data is captured in a structured way from the start, scaling coverage does not break existing analyses. New sources slot into the same framework instead of forcing redesigns.
Ethical boundaries reduce risk for HR tech teams
Ethics in job market data is not an abstract concern. HR tech leaders increasingly need to demonstrate that their analytics practices respect public data norms and avoid opaque or questionable collection methods.
JobsPikr’s approach emphasizes publicly available job postings and avoids intrusive data collection practices. This reduces compliance risk and makes it easier for teams to stand behind their labor analytics outputs internally and externally.
According to a 2024 World Economic Forum discussion on labor market intelligence, transparency and explainability are becoming prerequisites for trusted workforce analytics, not optional extras. Building ethical boundaries into data collection is a practical way to meet that expectation.
At this stage, nothing has been analyzed yet. But the foundation has been set. Job market data is collected with structure, context, and traceability in mind, so when transformation and enrichment begin, the insights engine is working with material it can trust.
How Data Transformation Turns Messy Postings into Analysis-Ready Job Market Data
Once job market data is collected, the hardest part begins. This is where most labor analytics efforts quietly struggle. Raw postings may be traceable and ethical, but they are still inconsistent, repetitive, and difficult to compare. Data transformation is the step that makes job data analytics usable at scale, not by adding new information, but by making existing information line up.
In the JobsPikr insights engine, transformation is treated as a core capability, not a cleanup task. The goal is simple: make postings comparable across companies, regions, and time without flattening away meaningful differences.
Title normalization standardizes role naming across employers

Image Source: Lightcast
Job titles are one of the noisiest parts of job market data. Companies use titles to attract attention, signal culture, or mirror internal levels, not to make analytics easy. As a result, the same role can appear under dozens of variations.
Title normalization groups these variations into consistent role families so labor analytics can compare like with like. This does not mean forcing everything into a rigid taxonomy. It means identifying when different titles point to the same underlying work.
Role clustering reduces creative title distortion
Terms like “ninja,” “guru,” or “hero” are stripped back to the functional role they represent. This prevents creative branding from fragmenting job data analytics.
Seniority signals are separated from role names
Words such as junior, senior, lead, or principal are extracted and treated as seniority signals rather than embedded inconsistently in titles.
Cross-industry title alignment improves benchmarking
A “Data Analyst” in retail and a “Business Analyst” in logistics may map to similar skill sets. Normalization allows these roles to be compared without pretending they are identical.
Why title normalization changes analytical outcomes
Without normalized titles, trend analysis often overcounts niche roles and undercounts core ones. Normalization brings hiring demand back into focus.
Location normalization maps postings into comparable geographies
Location data looks simple until you try to analyze it. The same place can appear as a city, a metro area, a state, or a remote label. Without normalization, geographic labor analytics becomes unreliable very quickly.
JobsPikr standardizes locations into consistent geographic layers so postings can be aggregated, compared, and visualized accurately.
City, metro, and country layers prevent category mixing
By mapping locations into defined layers, the insights engine avoids comparing a city-level signal with a national one.
Remote and hybrid roles are labeled explicitly
Remote and hybrid postings are treated as distinct categories instead of being mixed into physical locations. This keeps geographic trends clean and interpretable.
Regional naming inconsistencies are resolved
Differences such as “Bengaluru” versus “Bangalore” or abbreviated region names are unified so counts reflect reality, not spelling choices.
Why normalized geography matters for workforce decisions
Hiring strategy often hinges on location. When geography is inconsistent, decisions about expansion, contraction, or remote work rest on shaky ground.
Company resolution links brands, subsidiaries, and parent entities
Large organizations rarely post jobs under a single name. Subsidiaries, acquired brands, and regional entities all appear separately in raw job market data.
Company resolution connects these dots. It ensures that job data analytics reflects true employer-level activity rather than fragmented brand footprints.
This matters for competitive analysis, market share estimation, and long-term trend tracking in labor analytics.
De-duplication prevents false spikes in job data analytics
Even with clean titles and locations, duplicates remain one of the biggest threats to accuracy. JobsPikr applies de-duplication logic that goes beyond exact text matching to identify near-identical roles posted multiple times.
Near-duplicate matching protects trend integrity
Slight changes in wording or formatting no longer create artificial growth signals.
Time-window logic distinguishes reposts from new demand
Roles reposted within defined windows are treated differently from genuinely new openings.
Cross-source reconciliation reduces volume inflation
When the same role appears across multiple platforms, it is recognized as a single demand signal.
Why de-duplication underpins trustworthy labor analytics
Without this step, every downstream insight, from hiring velocity to skill demand, risks being overstated.
At the end of transformation, job postings are no longer a loose collection of text. They are structured, comparable, and stable enough to support data enrichment and analysis. This is the moment where raw job market data becomes analysis-ready, and where the insights engine earns its name.
Turn job market data into decisions you can stand behind
If you are tired of second-guessing charts and want labor analytics that holds up in real planning conversations, it starts with the right insights engine.
How Enrichment Adds Meaning to Normalized Job Postings
Once job postings are normalized, they are cleaner, but they are still largely descriptive. They tell you what was written, not what it means for the labor market. Enrichment is the step where job data analytics starts answering deeper questions about skills, roles, and workforce dynamics. This is where normalized job market data turns into something that can support real labor analytics.
In the JobsPikr insights engine, enrichment is not about guessing or over-interpreting. It is about adding just enough structure and context to make patterns visible without distorting the underlying data.
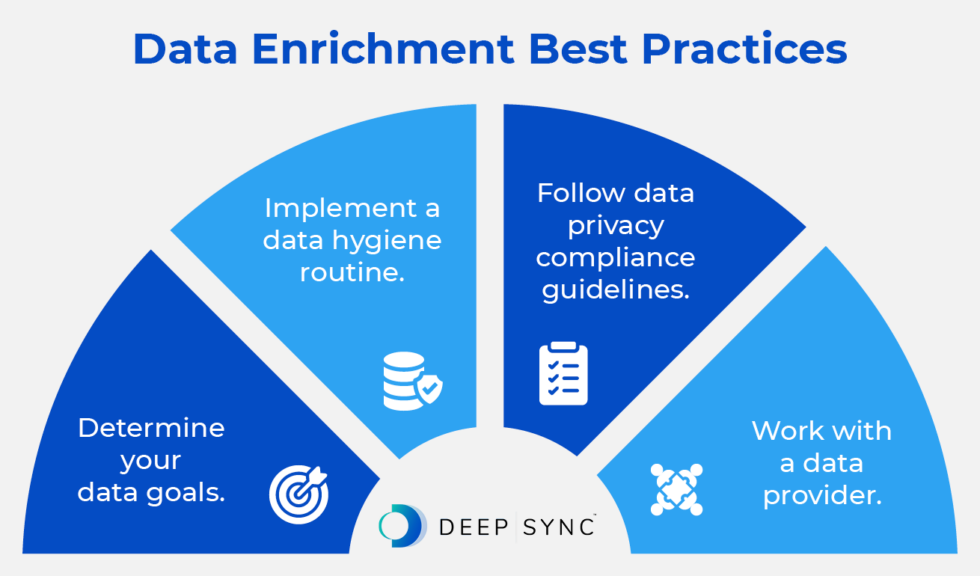
Image Source: Deep Sync
Skills extraction converts descriptions into structured skill signals
Job descriptions are dense with information, but that information is buried in free text. Skills extraction pulls those signals out and represents them in a consistent way so they can be analyzed across roles and markets.
The insights engine identifies both technical and functional skills while accounting for how different companies describe the same capability. For example, one posting might say “data visualization using Tableau,” while another says “dashboarding experience.” Enrichment aligns these references without assuming they are always interchangeable.
According to LinkedIn’s Economic Graph research, skills-based analysis of job postings has become one of the most reliable ways to track shifting labor demand, precisely because titles alone lag behind real change. This is why skills extraction is central to modern labor analytics.
Seniority and function inference creates usable segmentation
Not all roles with the same title operate at the same level. Seniority and function inference looks beyond the title to understand where a role sits in an organization and what kind of work it actually involves.
Language patterns signal experience expectations
Phrases related to ownership, scope, and decision-making are used to infer whether a role is entry-level, mid-level, or senior. This prevents titles from being the sole indicator of seniority.
Responsibility breadth separates specialist and leadership roles
Job descriptions often reveal whether a role is execution-focused or responsible for guiding teams and strategy. Capturing this distinction improves role segmentation in job data analytics.
Function inference aligns roles to comparable categories
A role titled “Operations Analyst” might sit closer to supply chain in one company and finance in another. Enrichment assigns functions based on responsibilities, not just labels.
Why confidence scoring matters in inference
The insights engine assigns confidence levels to inferred attributes. This avoids overconfidence in ambiguous cases and allows analysts to filter or weight insights appropriately.
Industry and occupation mapping enables benchmarking in labor analytics
To compare labor demand across markets, roles need to be mapped to broader industry and occupation frameworks. This step supports benchmarking without erasing nuance.
JobsPikr aligns enriched postings to standard industry and occupation classifications so trends can be compared across regions and time periods. This makes it possible to answer questions like whether demand for a role is rising faster in one sector than another, or whether skill requirements are diverging within the same occupation.
Public labor market institutions such as the U.S. Bureau of Labor Statistics increasingly reference online job posting analytics alongside traditional surveys, highlighting how enriched job market data complements official statistics rather than replacing them. That alignment is what makes enriched labor analytics credible.
By the end of enrichment, job postings are no longer just cleaned text. They carry structured signals about skills, seniority, function, and industry. This is the layer that allows the JobsPikr insights engine to move from describing the market to interpreting it in a way analytics teams can trust.
How the Labor Analytics Engine Converts Signals into Decisions Teams Can Defend
Here’s the truth: even “clean” job market data can still lead you to the wrong call if you treat every chart as truth. Hiring signals move for a lot of reasons, and most of them have nothing to do with the story people want to tell in a meeting.
A labor analytics engine earns its keep when it helps you answer two questions without hand-waving:
What changed, and do we trust it enough to act on it?
That’s the job of the JobsPikr insights engine at this stage. Not to produce more graphs. To reduce the risk of wrong conclusions.
Trend analysis separates patterns from panic
Raw job data analytics often makes normal movement look like a crisis. A sudden jump in postings might be a real shift, or it might just be reposting behavior, a seasonality cycle, or a platform change that altered how roles appear.
So the labor analytics engine has to treat trends like evidence, not headlines. It looks for consistency over time, checks whether the change shows up across sources, and validates whether the underlying mix of roles and skills actually moved. If the volume changed but the skill signals and role clusters stayed stable, that is usually not a structural shift. It is noise with good marketing.
The end goal is simple: if a trend is real, it should hold up when you zoom in and when you zoom out.
Benchmarking creates context so teams stop overreacting to raw counts
A number without context is just a number. “500 postings for data engineers” sounds big until you realize it is normal for that industry, or concentrated in one metro, or driven by a small set of employers reposting weekly.
Benchmarking is how the insights engine keeps teams grounded. It does not ask, “Is this high?” It asks, “High compared to what, and for whom?”
Peer cohorts keep comparisons honest
Comparing a mid-size fintech to a global IT services firm is a fast way to get misleading conclusions. Cohorts matter. The labor analytics engine benchmarks within sensible peer sets so you are not mixing incompatible realities.
Market baselines stop “internal-only” interpretation
A spike inside your tracking view might just reflect the market moving as a whole. Baselines give you the outside reference point, so you can tell whether something is unique to your segment or just the tide going up.
Relative shifts matter more than absolute volume
Sometimes the most useful signal is not the biggest category, but the one changing fastest. Job market data becomes actionable when you can see where the slope is changing, not just where the bar is tall.
Good benchmarking protects decision credibility
This is the part people forget. Leaders do not just want an insight, they want to know it will not collapse the moment someone challenges it. Benchmarking gives your conclusion a spine.
Explainability keeps insights from dying in a slide deck
Even strong insights get ignored if no one can explain them. Analytics teams might trust a model, but stakeholders trust a story they can follow.
That is why the JobsPikr insights engine is built to keep a clear trail from outcome back to inputs. When it says demand for a skill is rising, you should be able to trace that back to the enriched skill signals, the normalized roles those skills sit in, and the underlying postings that produced the pattern. Not because people love audits, but because teams move faster when they do not have to argue about whether the data is real.
A labor analytics engine works when it makes decision-making calmer. Less guesswork. Fewer false alarms. More confidence that what you are acting on is happening in the market.
Turn job market data into decisions you can stand behind
If you are tired of second-guessing charts and want labor analytics that holds up in real planning conversations, it starts with the right insights engine.
What Decisions HR Tech and Analytics Teams Can Support with Job Data Analytics
When job market data is messy, teams use it like a weather app. A quick glance, a vague feeling, and then everyone goes back to doing what they were doing anyway.
When the data is usable, something changes. You stop asking “What does this chart say?” and start asking “What should we do next week, next quarter, and what do we stop doing?”
That is the practical end game of job data analytics. Not a fancy report. Better decisions that do not fall apart the moment someone challenges them.
Workforce planning shifts from guesswork to grounded calls
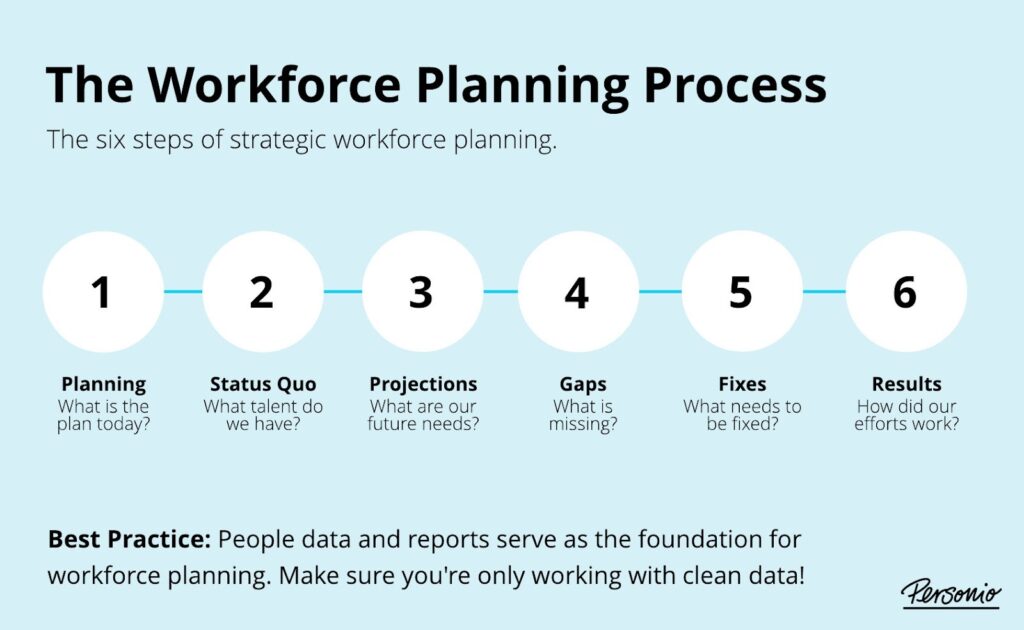
Image Source: Personio
Most workforce planning debates sound the same. One side says, “This role is getting impossible to hire.” Another says, “No, it is just our process.” Someone pulls up a few anecdotal examples, and the discussion becomes a mix of opinion and urgency.
Job data analytics gives you an external reference point to break that loop.
If demand for a role is rising across the market, you will see it. If it is stable but your hiring is slow, that is a different problem and you should not solve it with more budget or more recruiters. If the role is stable but skill expectations are changing, you will spot that drift early, before your job descriptions and interview rubrics get outdated.
This is the real value for analytics teams. You get a way to pressure-test internal assumptions without turning every conversation into a debate about who is “right.”
Talent intelligence turns competitor hiring into something you can actually use
Competitive hiring data is easy to misread. A competitor posts 200 roles and suddenly it looks like they are scaling aggressively. But a lot of that volume can be backfills, reposts, or the same openings syndicated across platforms.
A useful labor analytics engine forces you to look past the headline number.
You can break competitor activity down into what roles they are hiring for consistently, what functions are getting attention, and which skills keep showing up across postings. You can also see whether the hiring is concentrated in one region or scattered across markets, which changes how you interpret it.
That kind of view is what makes competitor signals usable. It keeps teams from reacting to noise, and it gives product and GTM teams a clearer sense of where the market is placing bets.
Skills strategy becomes less trend-chasing and more evidence-driven
Skills conversations get messy fast because everyone has a favorite narrative. AI skills are exploding. Cloud skills are table stakes. This framework is dying. That tool is winning. Most of it is said with a lot of confidence and not much proof.
Job market data is not perfect, but it is one of the fastest ways to see how employers are describing work right now. With job data analytics, you can track which skills are showing up more often, which ones are fading, and where they show up.
That last part matters. A skill appearing mostly in junior roles is a very different signal than the same skill moving into senior roles. A skill that appears in one industry but not others is not a universal shift, it is a pocket of demand. Those distinctions help HR tech and analytics teams make calmer choices, whether it is about reskilling priorities, how roles are defined, or where hiring should focus.
The point is not to predict the future with certainty. It is to avoid building plans on stale assumptions when the market has already moved.
How Data Visualization Makes Labor Analytics Easier to Act On
Most teams do not struggle because they lack charts. They struggle because the charts do not help them decide anything. A screen full of graphs can look impressive and still leave everyone asking the same question at the end of the meeting: “So… what does this mean for us?”
Good data visualization in labor analytics is not about showing everything. It is about reducing cognitive load so patterns stand out without explanation.

Decision-first views reduce monitoring fatigue
When dashboards are built around metrics instead of decisions, people stop using them. You see this all the time. Someone checks the dashboard once a week, nods, and closes the tab.
JobsPikr’s approach to visualization starts with the question the user is trying to answer. Are we seeing a real change in demand? Are we ahead or behind the market? Are skill requirements drifting? Each view is designed to answer one of those questions clearly, without forcing the viewer to mentally reconcile five different charts.
This matters because labor analytics is rarely consumed by one person. Recruiters, planners, product teams, and leadership all look at the same data from different angles. When the visualization is decision-first, the conversation stays focused instead of drifting into interpretation debates.
Visual guardrails prevent common interpretation errors
Job market data is especially easy to misread visually. A rising line can mean growth, noise, or a data artifact. A large bar can represent real demand or simple reposting behavior. Visualization has to account for those risks.
Clear baselines anchor interpretation
Every trend needs a reference point. Without a baseline, viewers instinctively compare against their own expectations, which vary wildly. Anchoring visuals to market medians or historical norms keeps interpretation grounded.
Normalized views prevent scale distortion
Large markets will always dominate raw counts. Normalized views, such as percentage change or indexed trends, allow smaller but faster-moving segments to surface without being drowned out.
Contextual annotations explain sudden shifts
When something unusual happens, the visualization should acknowledge it. A platform change, policy shift, or seasonal effect that explains a spike should be visible, not buried in a footnote.
Consistent definitions avoid silent confusion
If a “role,” “posting,” or “skill” means something slightly different from one chart to the next, trust erodes fast. Consistency across views keeps labor analytics interpretable over time.
The result is not prettier dashboards. It is quieter meetings. Fewer arguments about what the data is saying. More time spent discussing what to do next.
How JobsPikr Maintains Quality so the Insights Engine Stays Trustworthy Over Time
Job market data is not a one-time problem you solve and move on from. It changes every day. Sources shift their formats, companies change how they write roles, and platforms adjust how postings appear. If quality is not actively maintained, even a well-built insights engine slowly drifts out of sync with reality.
This is where many labor analytics efforts quietly degrade. The first few months look solid. A year later, teams stop trusting the numbers, not because anything dramatic broke, but because small inconsistencies piled up.
JobsPikr treats quality as an ongoing process, not a setup task.
Freshness controls prevent stale job market data from shaping strategy
Outdated postings are one of the fastest ways to corrupt labor analytics. A role that stayed live for six months might look like sustained demand, when in reality it was never filled or never taken down.
The insights engine continuously checks posting activity and change signals to understand whether a role is active, updated, reposted, or effectively stale. This keeps time-based analysis grounded in what is happening now, not what lingered in a database.
For analytics teams, this matters because decisions about hiring velocity, demand trends, and market tightness depend heavily on timing. Freshness is not a nice-to-have. It is foundational.
Validation checks catch drift before it becomes visible
As data volume grows, small issues can scale quietly. A field starts coming in empty from one source. A title pattern changes. A location format shifts. If these changes go unnoticed, they distort analysis long before anyone spots a problem in a chart.
JobsPikr runs continuous validation checks across incoming job market data to detect anomalies early. These checks look for unexpected drops, sudden spikes, schema mismatches, and unusual distributions that suggest something changed upstream.
Schema consistency keeps analytics stable
When fields shift or break, downstream logic can fail silently. Monitoring schema consistency ensures that job data analytics continues to operate on the assumptions it was designed for.
Distribution checks flag subtle errors
If a skill suddenly disappears from thousands of postings overnight, that is rarely a real market event. Distribution checks help distinguish real shifts from ingestion or parsing issues.
Cross-source comparisons surface anomalies
When one source behaves very differently from others, it raises a flag. This cross-checking protects the insights engine from becoming overly dependent on any single input.
Early detection prevents downstream rework
Catching issues at ingestion or transformation is far cheaper than fixing insights after teams have already acted on them.
Lineage and reproducibility support long-term trust
Trust in labor analytics is built over time, not in a single presentation. Teams need to know that when they revisit an insight months later, they can understand how it was produced and whether the same logic still applies.
JobsPikr maintains clear data lineage so insights can be traced back through enrichment, normalization, and source-level inputs. This makes it possible to reproduce analyses, explain differences between time periods, and answer follow-up questions without redoing the entire pipeline.
For HR tech and analytics teams, this is what turns an insights engine into infrastructure. Something you rely on repeatedly, rather than something you double-check every time.
Quality work is rarely visible when it is done well. But it is the reason the JobsPikr insights engine continues to produce labor analytics that teams trust enough to use, even as the job market itself keeps changing.
Turn job market data into decisions you can stand behind
If you are tired of second-guessing charts and want labor analytics that holds up in real planning conversations, it starts with the right insights engine.
How to Evaluate an Insights Engine Before You Commit to a Labor Analytics Platform
By the time teams start looking for a labor analytics engine, they have usually been burned once already. Maybe by a job data feed that looked comprehensive but fell apart under analysis. Maybe by dashboards that worked for a quarter and then stopped making sense. So the evaluation question is rarely “Does this have data?” It is “Will this hold up once we actually rely on it?”
This is where being deliberate pays off. An insights engine should reduce uncertainty, not add a new layer of it.
Coverage, comparability, and repeatability define usefulness
Coverage sounds straightforward, but it is not just about how many postings a platform claims to have. What matters is whether coverage is consistent across regions, roles, and time. Gaps that appear and disappear quietly can derail trend analysis without anyone noticing.
Comparability is the next filter. If the engine cannot reliably compare the same role across companies or the same market across quarters, the insights will always be fragile. Ask how titles, locations, and companies are normalized, and whether that logic stays stable as data scales.
Repeatability is the final piece. If you run the same analysis next month, will you get results that make sense relative to today? Labor analytics only becomes valuable when teams can track movement over time without resetting their assumptions every cycle.
Governance, documentation, and traceability define trust
Most platforms talk about insights. Fewer talk about governance. That silence usually shows up later.
An insights engine should be able to explain where its data comes from, how it is transformed, and how changes are handled. Documentation matters here, not for compliance theater, but because analytics teams need to understand the system well enough to defend its outputs internally.
Traceability is especially important. When a number is questioned, can you trace it back to the underlying job market data and see what changed? If the answer is no, the engine will eventually be sidelined, no matter how impressive it looked at first.
Time-to-insight and maintainability define long-term ROI
The hidden cost of many labor analytics tools is maintenance. If every new question requires custom logic, manual cleanup, or one-off fixes, teams stop asking questions.
A strong insights engine shortens the distance between curiosity and clarity. It lets teams explore new angles without rebuilding the pipeline each time. That speed compounds. Over time, it changes how often data is used and how central it becomes to decision-making.
Maintainability is what keeps that momentum going. If the system adapts as the job market evolves, rather than breaking under change, it becomes an asset instead of a recurring project.
Choosing a labor analytics platform is not about picking the one with the most features. It is about picking the one that stays boring in the best possible way. Predictable, explainable, and still useful when the initial excitement wears off.
How to Start with JobsPikr Without Overbuilding Your Labor Analytics workflow
The fastest way to kill a labor analytics project is to start with a “full platform rollout.” Big data pull, big dashboard, big expectations. Everyone nods in the kickoff. Three weeks later, it is still unclear what decisions this is meant to improve, and the only people using it are the people who built it.
Starting with the JobsPikr insights engine works better when you treat it like any other analytics system: prove one thing, make it repeatable, then expand.
A narrow first use case reduces confusion and forces clarity
Pick one question that a real person in your org already argues about. Not a broad question like “Where is the market going?” Choose something you can validate quickly, like:
Are data analyst roles shifting toward more SQL plus BI, or more Python plus automation in our target region?
Are competitor companies hiring for security engineers as a separate function, or bundling it into platform roles?
When the scope is narrow, your job data analytics stays honest. You can sanity-check the output against what your recruiters, hiring managers, or product team already sees on the ground. If it matches reality, you have earned trust. If it does not, you can trace where the mismatch came from without wading through ten dashboards.
This is also the quickest way to show why an insights engine matters. People feel the difference when the data is structured enough to answer a specific question cleanly.
A 30-day baseline gives you a reference point that stops overreactions
Teams love to act on the first spike they see. That is usually a mistake. Job market data moves all the time. A baseline is what tells you whether a change is meaningful or just normal movement.
A simple baseline window, even 30 days, does a few important things. It shows you what “normal” volume looks like for a role cluster. It reveals how often roles get reposted. It shows whether skill mentions are stable or drifting. Most importantly, it gives you context for the next month. Without that, every chart feels like breaking news.
This is where labor analytics becomes calmer. You stop jumping at shadows and start looking for sustained shifts.
A lightweight cadence keeps the insights engine useful instead of ignored
If labor analytics requires daily attention, it will not survive. People do not have the time, and they should not need it. What works is a simple rhythm that fits how decisions are made:
- A monthly review that answers, “What changed and what is worth caring about?”
- A quarterly deep dive that feeds workforce planning or product strategy
- Ad-hoc checks when something external shifts, like a new regulation, a major layoff wave, or a competitor entering a market
With that cadence, the insights engine becomes a support layer. It shows up when decisions are being made, not as a scoreboard people feel guilty about not checking.
Start small, build a baseline, and keep the cadence simple. That is how the JobsPikr insights engine becomes something teams use. Not as another dashboard, but as a reliable way to pressure-test assumptions and make labor analytics part of real planning.
Turn job market data into decisions you can stand behind
If you are tired of second-guessing charts and want labor analytics that holds up in real planning conversations, it starts with the right insights engine.
FAQs:
What is an insights engine in labor analytics?
It is a part of the system that makes job market data usable. Not prettier. Not louder. Usable. Raw postings are full of repeat roles, inconsistent titles, mixed-up locations, and text that is written for candidates, not for analysis. An insights engine takes that mess and turns it into structured signals you can compare across time, companies, and regions. If you have ever had two teams pull “the same” report and get different answers, that is usually because the insights engine layer was missing or weak.
How is a labor analytics engine different from a job data feed?
A feed is a delivery pipe. It drops a lot of postings into your lap and says, “Good luck.” A labor analytics engine is what you build, so you do not spend the next six months doing cleanup work and arguing about definitions. With a feed, your team ends up writing rules for duplicates, reposts, title mapping, location mapping, and skill extraction, and then maintaining those rules forever. A labor analytics engine gives you a consistent layer where those decisions are already handled, so you can spend time on analysis and decision-making instead of data janitor work.
Why is data transformation critical for job data analytics?
Because most “insights” fall apart the second someone asks a basic follow-up. If you do not transform the data, your counts are inflated by reposts, your categories are fragmented by title variations, and your geography is unreliable because “Remote,” “Hybrid,” “NYC,” and “New York, NY” get treated like different worlds. Data transformation fixes the boring things that ruin trust: standardizing titles, normalizing locations, resolving company identities, and removing duplicates. It is not optional. Without it, job data analytics looks confident but behaves like guesswork.
How reliable is job market data for workforce planning?
It is reliable enough to be useful, but only if you treat it the right way. Job postings reflect intent, what employers say they want, and they update faster than most internal reports. At the same time, postings are messy and biased toward where companies choose to advertise. So the reliability is not about “is job data perfect.” It is about whether your labor analytics engine controls for the obvious distortions: duplicates, reposting behavior, inconsistent titles, inconsistent locations, and uneven source coverage. When those are handled, job market data becomes a strong external reference for planning, benchmarking, and spotting shifts early.
How does JobsPikr support ethical and future-ready labor analytics?
JobsPikr is built so teams can explain where an insight came from and why it is trustworthy. That starts with sticking to publicly available job postings and continues with traceable processing, so you are not forced to treat the output like a black box. In practice, this means the system is designed for transparency: consistent rules for how data is transformed, how duplicates are handled, how fields are standardized, and how signals are derived. “Future-ready” here is not a buzzword. It just means the system can keep working as sources change, and your team can still defend the numbers a year from now.