- Why a Workforce Management ROI Calculator Actually Matters
- The Real Cost of Poor Workforce Planning (And Why It Rarely Shows Up on a Balance Sheet)
- Invest in Workforce Intelligence That Pays for Itself
- What a Workforce Management ROI Calculator Actually Measures
- How the Workforce Management ROI Calculator Works in a Real Planning Cycle
- Make Workforce Planning Defensible at the CFO Level
- Why Most Workforce ROI Calculators Fail
- How Workforce Intelligence Turns a Workforce Management ROI Calculator Into a Real Decision Engine
- Make Workforce Planning Defensible at the CFO Level
- Presenting the Workforce Management ROI Calculator to CFOs and Boards
- How to Use a Workforce Management ROI Calculator in Your Actual Planning Cycle
- Smarter Workforce Planning Is Measurable, Not Aspirational
- Make Workforce Planning Defensible at the CFO Level
- FAQs
Why a Workforce Management ROI Calculator Actually Matters
Most organizations know workforce planning is important. What they don’t know is how much inaccurate workforce planning is quietly costing them.
Vacant roles delay revenue. Overhiring inflates fixed costs. Compensation misalignment increases attrition. And reactive hiring forces expensive last-minute decisions. According to the U.S. Bureau of Labor Statistics, job openings in the U.S. have consistently remained in the millions in recent years, signaling persistent hiring gaps across industries. Every open role represents work that isn’t getting done on time.
A workforce management ROI calculator translates those gaps into financial terms. It measures the cost of delayed hiring, forecast variance, attrition exposure, and skill shortages. More importantly, it shows what happens to those numbers when workforce intelligence improves.
This is not about abstract HR analytics ROI. It is about cost optimization that finance leaders can see, model, and defend.
Instead of asking leadership to believe in better workforce planning, you show them the math.
The Real Cost of Poor Workforce Planning (And Why It Rarely Shows Up on a Balance Sheet)
Workforce planning rarely fails in a dramatic way. It erodes performance quietly.
A role stays open longer than expected. A project slows down. A team absorbs extra workload. Overtime increases. Attrition ticks up. Finance sees higher operating costs, but the root cause is often forecast error.
Let’s ground this in current data.
According to the U.S. Bureau of Labor Statistics, there were 8.8 million job openings in March 2024, based on the latest Job Openings and Labor Turnover Survey (JOLTS) release available at the time of writing.
That number matters because every open role represents work not being completed at full capacity. In revenue-generating functions, that means delayed output. In operational roles, it means strain on existing teams.
Now look at turnover. The Work Institute’s 2023 Retention Report (latest edition currently available) estimates that replacing an employee can cost up to 33 percent of that employee’s annual salary when recruiting, onboarding, and lost productivity are included.
Even if you apply that conservatively, the impact scales quickly. If your workforce planning assumptions underestimate attrition by just a few percentage points, replacement costs compound across departments.
There is also the broader macro pressure. According to the World Economic Forum’s Future of Jobs Report 2023, 44 percent of workers’ skills are expected to be disrupted within five years. While this report predates 2024, it remains the latest global structural analysis on workforce skill shifts and continues to be referenced in 2024–2026 planning discussions.
Skill disruption matters because inaccurate workforce planning is no longer just about headcount. It is about capability mismatch. Hiring the wrong skill profile or failing to anticipate demand shifts creates re-hiring cycles, retraining costs, and productivity gaps.
What makes all of this difficult is that the cost is fragmented.
Some of it shows up in recruiting spend. Some in overtime budgets. Some in contractor invoices. Some in missed revenue targets.
Because it is distributed, it rarely gets labeled as a workforce planning failure.
This is the hidden financial leakage that a workforce management ROI calculator is designed to expose. It consolidates vacancy cost, turnover exposure, compensation misalignment, and skill forecasting gaps into one measurable framework.
Instead of saying “we think we are losing money due to reactive hiring,” you can model the difference between forecast-driven hiring and urgent backfill hiring.
And once that delta is quantified, workforce planning stops being a qualitative discussion. It becomes a financial risk conversation.
This is exactly why organizations are turning to a workforce management ROI calculator instead of relying on static headcount spreadsheets. When planning assumptions are stress-tested through a workforce management ROI calculator, hidden cost exposure becomes visible immediately.
Invest in Workforce Intelligence That Pays for Itself
Review JobsPikr’s job data pricing and subscription options designed for enterprise workforce planning and analytics.
What a Workforce Management ROI Calculator Actually Measures
A workforce management ROI calculator should not rely on industry averages. It should run on your internal data and external workforce intelligence inputs. The power comes from modeling deltas, not citing reports.
A properly built workforce management ROI calculator does not estimate impact in abstract terms. It calculates exposure role by role, assumption by assumption.
Here is what it calculates.
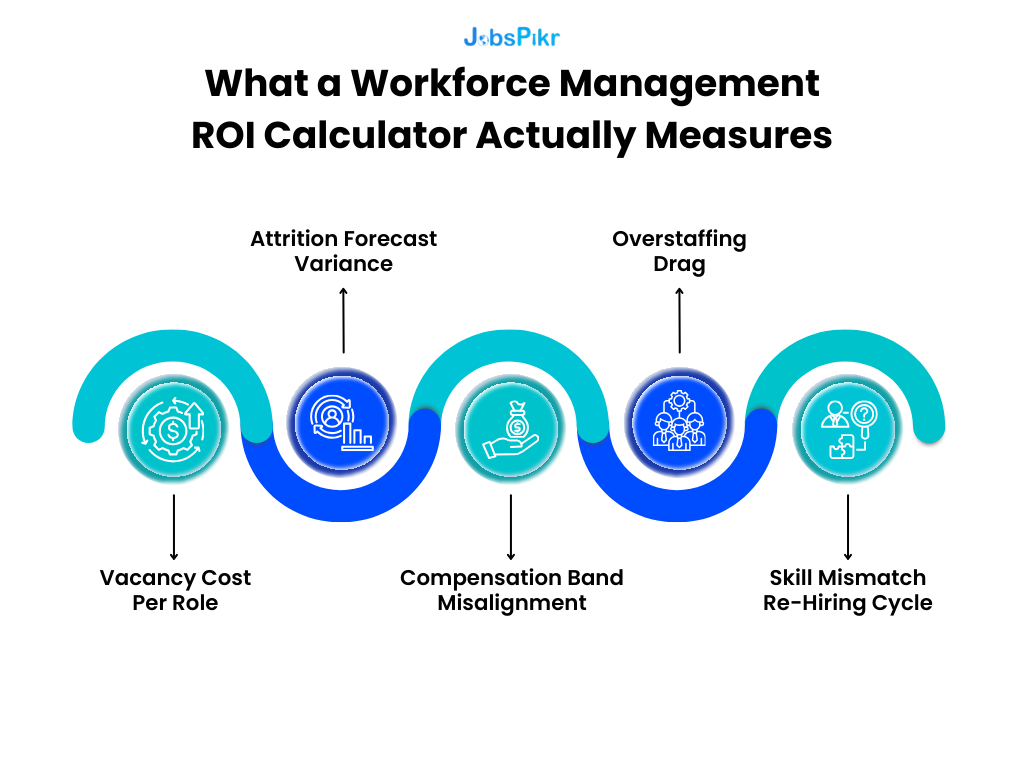
1. Vacancy Cost Per Role
This is the foundation.
Formula:
Vacancy Cost per Day = (Annual Revenue per Employee ÷ 260 Working Days)
If your organization generates $250M in revenue with 1,000 employees:
Revenue per Employee = 250,000,000 ÷ 1,000 = $250,000
Daily Revenue per Employee ≈ 250,000 ÷ 260 ≈ $962
If a revenue-linked role stays vacant 45 extra days beyond forecast:
Vacancy Impact = 962 × 45 ≈ $43,290 per role
Now scale that across 50 delayed roles:
43,290 × 50 = $2.16M in revenue exposure
A workforce ROI calculator does not assume revenue. It uses your revenue per FTE and your time-to-fill variance.
That’s hr analytics roi in real money.
2. Attrition Forecast Variance
Most organizations plan for expected attrition, for example 12 percent annually. But what matters is forecast error.
Formula:
Attrition Variance Cost = (Actual Attrition − Planned Attrition) × Headcount × Replacement Cost per Employee
If you planned for 12 percent attrition but actual was 14 percent:
Variance = 2%
In a 5,000 employee organization:
Extra Exits = 5,000 × 2% = 100 employees
If average salary is $80,000
Replacement Cost at 30% = $24,000 per employee
Variance Impact = 100 × 24,000 = $2.4M
The workforce management ROI calculator shows what improved forecasting accuracy does.
If workforce intelligence reduces variance from 2% to 0.5%:
Savings = 75 employees × 24,000 = $1.8M retained
That is cost optimization driven by planning precision.
3. Compensation Band Misalignment
Compensation errors create two financial risks: overpaying or losing talent.
Formula:
Compensation Drift Cost = (Offer Premium % × Salary × Number of Urgent Hires)
If 20% of your hires are urgent and require a 12% premium:
Assume:
200 hires annually
Average salary = $100,000
Urgent hires = 40
Premium = 12%
Premium Cost = 40 × (100,000 × 12%)
Premium Cost = 40 × 12,000 = $480,000
Now compare that to forecast-based hiring where premium drops to 5%.
Revised Premium = 40 × (100,000 × 5%) = $200,000
Difference = $280,000
A workforce ROI calculator surfaces that delta clearly.
4. Overstaffing Drag
Under-hiring gets attention. Over-hiring is quieter.
Formula:
Overstaffing Cost = Excess Headcount × Fully Loaded Cost per Employee
If demand forecast was 10% too high in a 1,000-person division:
Excess Roles = 100
Fully Loaded Cost per Employee (salary + benefits + overhead) = $120,000
Overstaffing Impact = 100 × 120,000 = $12M
Even if that overestimation lasts only 6 months:
Half-Year Drag = $6M
That is a direct margin hit caused by inaccurate workforce planning.
5. Skill Mismatch Re-Hiring Cycle
When planning relies on historical demand instead of current labor market signals, organizations hire for skills that are declining in relevance.
Formula:
Skill Mismatch Cost = (Rehire Rate × Replacement Cost × Affected Roles)
If 8% of new hires require replacement within 12 months due to skill misalignment:
In 500 hires: 40 replacements
Replacement Cost per hire = $25,000
Impact = 40 × 25,000 = $1M
Workforce intelligence reduces mismatch risk by aligning hiring with real-time market demand signals.
Now you start seeing what a workforce management ROI calculator really is.
It is not a static worksheet. It is a variance reduction engine.
It quantifies how improved workforce planning accuracy reduces:
- Revenue leakage
- Replacement volatility
- Compensation premiums
- Overstaffing drag
- Skill re-hiring cycles
And when you stack those variables together, the total ROI becomes measurable.
At scale, the workforce management ROI calculator becomes less about reporting HR metrics and more about reducing enterprise-wide financial variance.
How the Workforce Management ROI Calculator Works in a Real Planning Cycle
Now let’s move from isolated formulas to a full-year scenario.
Because this is where a workforce management ROI calculator either becomes compelling or collapses.
In practice, the workforce management ROI calculator becomes a working model that finance and HR review together, not just an HR-owned planning file.
Assume a mid-to-large enterprise with:
- 4,000 employees
- $800M annual revenue
- 15% annual hiring volume (600 hires per year)
- 13% planned attrition
We’ll model two scenarios:
Scenario A: Traditional workforce planning
Scenario B: Workforce planning supported by external workforce intelligence and tighter forecasting
The difference is forecast variance.
Step 1: Hiring Forecast Accuracy
Traditional planning underestimates attrition by 2%.
Planned exits: 4,000 × 13% = 520 exits
Actual exits (15%): 4,000 × 15% = 600 exits
Variance: 80 unplanned backfills
Assume average salary = $85,000
Replacement cost at 30% = $25,500
Unplanned Attrition Cost: 80 × 25,500 = $2,040,000
Now assume improved workforce intelligence reduces forecast error to 0.5%.
Revised exits = 4,000 × 13.5% = 540
Variance = 20 roles
Revised variance cost: 20 × 25,500 = $510,000
Delta captured by the workforce management ROI calculator:
$2,040,000 − $510,000 = $1,530,000
That is just from attrition variance tightening.
Step 2: Time-to-Fill Compression
Assume average time-to-fill is 60 days under reactive planning.
Improved forecasting allows pre-approval and earlier sourcing, reducing it to 45 days.
15-day improvement.
Revenue per employee: 800,000,000 ÷ 4,000 = $200,000 annually
Daily revenue ≈ 200,000 ÷ 260 ≈ $769
For 600 hires:
Vacancy Reduction Value: 769 × 15 days × 600 hires
= 769 × 9,000
≈ $6,921,000
Even if you discount that by 50% to stay conservative, the impact is still over $3.4M.
That is not theoretical hr analytics roi. That is operational acceleration.
Step 3: Urgent Hiring Premium Reduction
Under traditional planning:
25% of hires are urgent (150 roles)
Premium = 10% above band
Average salary = $85,000
Urgent Premium Cost: 150 × (85,000 × 10%)
= 150 × 8,500
= $1,275,000
Under forecast-based hiring:
Urgent hiring drops to 10% (60 roles)
Revised premium cost: 60 × 8,500
= $510,000
Savings: $1,275,000 − $510,000 = $765,000
This is direct cost optimization driven by better workforce planning inputs.
Step 4: Overstaffing Risk Reduction
Traditional planning overshoots demand by 3% in certain functions.
In a 4,000 employee organization:
3% excess = 120 roles
Fully loaded cost per employee = $110,000
Annual exposure = 120 × 110,000 = $13,200,000
If improved demand signals cut overestimation in half (1.5% excess):
60 roles × 110,000 = $6,600,000
Reduced drag: $6.6M
Even if workforce adjustments take six months to correct:
Half-year gain ≈ $3.3M
Consolidated ROI View
Let’s combine conservative gains:
- Attrition forecast improvement: $1.53M
- Time-to-fill compression (discounted): $3.4M
- Urgent hiring premium reduction: $0.76M
- Overstaffing drag correction (half-year): $3.3M
Total Potential Impact ≈ $8.99M
Now compare that to investment in workforce intelligence infrastructure.
If annual spend on data + analytics platform = $500,000:
ROI Ratio ≈ 18:1
That is what a properly built workforce roi calculator surfaces.
Not “better decisions.”
Not “strategic alignment.”
Hard variance reduction tied to measurable financial outputs.
And the key variable across all of this is forecast accuracy.
Without real-time workforce intelligence inputs, these models rely on historical averages. With live labor market data, compensation benchmarks, and skill demand signals, the workforce management ROI calculator becomes dynamic.
This is where the workforce management ROI calculator proves its value. Even small improvements in forecast precision generate disproportionate financial impact.
Make Workforce Planning Defensible at the CFO Level
Discover how JobsPikr feeds your workforce management ROI calculator with real-time workforce intelligence.
Why Most Workforce ROI Calculators Fail
On paper, building a workforce management ROI calculator looks simple. Add headcount, plug in attrition, multiply by replacement cost, show savings.
Most workforce ROI calculators fail for three reasons.
- They rely on static assumptions.
- They ignore external labor signals.
- They measure activity, not variance reduction.
Let’s unpack this properly.
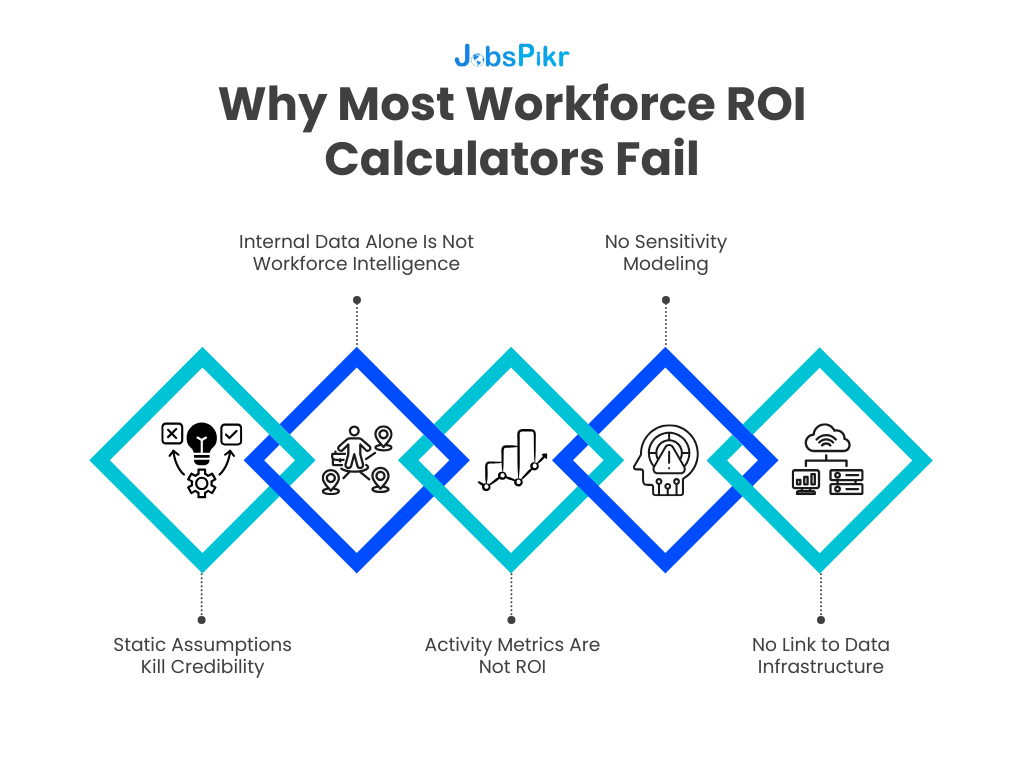
Static Assumptions Kill Credibility
Many internal HR models use last year’s attrition rate, last years’ time-to-fill, and a generic replacement cost multiplier.
The problem is that labor markets are not static.
The U.S. Bureau of Labor Statistics continues to report millions of job openings in its monthly JOLTS release, showing ongoing demand volatility across sectors.
If the external hiring environment shifts but your workforce planning model does not, your ROI projections drift away from reality. Finance notices quickly.
A workforce management ROI calculator must account for forward-looking signals. If it is backward-looking only, it becomes a reporting tool, not a decision engine.
Internal Data Alone Is Not Workforce Intelligence
Most HR analytics dashboards track:
- Historical attrition
- Historical time-to-fill
- Historical cost-per-hire
That is useful, but it does not explain why metrics are shifting.
For example:
If your time-to-fill increases by 20%, is it because of internal process friction, or because demand for that skill cluster has surged externally?
Without labor market benchmarks, you cannot isolate cause. And without isolating cause, your ROI math becomes guesswork.
A workforce ROI calculator built only on internal data measures symptoms. A workforce management ROI calculator powered by workforce intelligence measures drivers.
Activity Metrics Are Not ROI
This is a common mistake.
Organizations measure:
- Reduction in time-to-fill
- Increase in applicant volume
- Improvement in sourcing speed
Those are operational metrics. They are not ROI.
ROI requires connecting operational change to financial delta.
For example:
Reducing time-to-fill by 10 days means nothing unless you calculate:
Daily Output Value × Days Reduced × Roles Filled
Similarly, reducing attrition by 1% only becomes hr analytics roi when you multiply:
Headcount × Reduction % × Replacement Cost
If the calculator does not convert operational metrics into financial impact, it will not survive CFO scrutiny.
No Sensitivity Modeling
A robust workforce management ROI calculator must allow sensitivity testing.
What happens if:
- Attrition improves by only 0.5% instead of 2%?
- Time-to-fill drops by 7 days instead of 15?
- Urgent hiring decreases gradually over two quarters?
Without sensitivity bands, the model feels inflated. Scenario modeling feels realistic.
This is especially critical in enterprise environments where finance will stress-test assumptions immediately.
No Link to Data Infrastructure
The final failure point is structural.
If the workforce ROI calculator relies on manual updates and static spreadsheets, it becomes outdated quickly. Labor market signals shift monthly. Compensation bands move. Skill demand changes.
A sustainable workforce planning model requires continuous data inputs.
This is where workforce intelligence becomes foundational. Not as a dashboard, but as infrastructure. The calculator is only as accurate as the data feeding it.
When you combine:
- Real-time labor demand signals
- Compensation benchmarking
- Skill cluster trends
- Geographic hiring velocity
The workforce management ROI calculator evolves from a one-time business case tool into an ongoing planning engine.
A workforce management ROI calculator only works when it reflects current labor conditions and is treated as a living model rather than a static justification tool.
How Workforce Intelligence Turns a Workforce Management ROI Calculator Into a Real Decision Engine
Up to this point, we’ve talked about formulas and variance. But here’s the uncomfortable truth:
A workforce management ROI calculator is only as good as the data feeding it.
If your inputs are last year’s averages, the output is just a better-looking guess.
If your inputs reflect live labor demand, compensation shifts, and skill velocity, the calculator becomes a forward-looking planning tool.
This is where workforce intelligence changes the equation.
1. Improving Attrition Forecast Accuracy
Internal HR data can tell you historical attrition by function, region, and tenure. What it cannot tell you is whether attrition risk is rising externally.
For example, if demand for a specific role increases across the market, compensation pressure follows. Without external visibility into hiring intensity for that role, your attrition assumptions remain static.
A workforce management ROI calculator powered by workforce intelligence can adjust attrition sensitivity based on:
- External hiring velocity for specific roles
- Compensation inflation trends
- Skill demand acceleration
Instead of assuming 13% attrition across a function, you might model 13% baseline plus a 1–2% market risk factor.
That 1% difference, as shown earlier, can represent millions in replacement exposure.
2. Modeling Compensation Pressure Before It Hits Payroll
Most organizations adjust compensation reactively. Offers start failing. Counteroffers increase. Agency fees spike.
Workforce intelligence provides early indicators:
- Median compensation shifts in comparable roles
- Geographic pay differentials
- Skill premium escalation
When those signals feed into a workforce ROI calculator, compensation scenarios become predictive.
For example, instead of discovering midyear that offers require a 10% premium, you can model the impact of 5%, 8%, and 10% inflation in advance.
That allows finance to reserve budget strategically instead of scrambling.
This is where cost optimization becomes controlled rather than reactive.
3. Time-to-Fill Is a Market Variable, Not Just a Process Metric
Internal dashboards show your average time-to-fill. But they do not show market-level hiring competition.
If demand for a skill cluster doubles in your region, time-to-fill will extend even if your internal process remains constant.
Workforce intelligence layers in:
- External job posting growth by role
- Regional hiring competition
- Supply-demand imbalance indicators
A workforce management ROI calculator can then adjust vacancy risk dynamically.
Instead of assuming 60 days time-to-fill, the model can simulate 75-day risk in high-demand clusters.
That difference flows directly into vacancy cost modeling.
4. Location Strategy and Geographic Arbitrage
Workforce planning often assumes uniform hiring conditions across locations.
But labor markets vary dramatically by region in terms of supply, cost, and hiring velocity.
When workforce intelligence data feeds the calculator, you can compare:
Scenario A: Hire 100 roles in a saturated metro market
Scenario B: Hire 100 roles in a lower-demand secondary market
If average compensation differs by $15,000 per role and time-to-fill improves by 10 days, the financial delta becomes material.
100 roles × $15,000 = $1.5M compensation differential
Plus vacancy compression savings
Without external signals, that arbitrage opportunity stays invisible.
5. Making the Calculator Dynamic, Not Annual
Most workforce planning cycles are annual or biannual.
Labor markets shift monthly.
A static workforce roi calculator becomes outdated quickly. A dynamic one updates with:
- Monthly job posting velocity
- Quarterly compensation shifts
- Emerging skill cluster trends
That is where JobsPikr fits structurally.
JobsPikr does not “calculate ROI.” The workforce management ROI calculator does that.
JobsPikr supplies the real-time workforce intelligence inputs that reduce forecast variance inside the calculator.
The difference is subtle but critical.
Without workforce intelligence, ROI remains theoretical.
With continuous labor market data flowing in, the calculator becomes a decision-support engine tied to real external signals.
When workforce intelligence feeds directly into the workforce management ROI calculator, the model adjusts as the labor market shifts. That is the difference between annual forecasting and continuous workforce planning.
Make Workforce Planning Defensible at the CFO Level
Discover how JobsPikr feeds your workforce management ROI calculator with real-time workforce intelligence.
Presenting the Workforce Management ROI Calculator to CFOs and Boards
This is where most workforce planning business cases fall apart.
HR builds a thoughtful model. Finance asks two questions. The room goes quiet.
The issue is not the math. It is the framing.
A workforce management ROI calculator should never be presented as an “HR efficiency tool.” It should be positioned as a financial risk reduction model.
Here is how that shift happens.
1. Lead With Variance, Not Features
CFOs do not care about dashboards. They care about volatility.
Instead of saying, “We improved workforce planning accuracy,” say:
“Our current attrition forecast variance creates a $2M–$3M replacement exposure annually. With improved workforce intelligence inputs, we can reduce that variance by 50%, stabilizing roughly $1.5M in cost.”
Notice the difference.
You are not selling analytics. You are stabilizing financial variability.
The workforce management ROI calculator becomes a volatility compression tool.
2. Translate Workforce Metrics Into EBITDA Impact
Boards think in terms of operating margin.
Take the consolidated example from earlier where forecast improvements generated roughly $9M in potential annual impact.
If the organization operates at a 15% EBITDA margin:
$9M in recovered efficiency is equivalent to $60M in incremental revenue required to generate the same margin impact.
Calculation: Required Revenue = Impact ÷ Margin
9,000,000 ÷ 0.15 = 60,000,000
This comparison reframes workforce planning entirely.
Instead of chasing $60M in new sales, improving workforce planning precision delivers the same margin effect at a fraction of the operational risk.
That is the type of reframing a workforce roi calculator enables.
3. Show Conservative, Base, and Aggressive Scenarios
Finance distrusts single-point projections.
A credible workforce management ROI calculator should present:
- Conservative case
- Base case
- High-impact case
For example:
Attrition variance reduction
Conservative: 0.5% improvement
Base: 1% improvement
Aggressive: 2% improvement
Time-to-fill compression
Conservative: 5 days
Base: 10 days
Aggressive: 15 days
When leadership sees the impact range across scenarios, the model feels grounded. It becomes clear that even modest improvements produce measurable returns.
This strengthens hr analytics roi credibility.
4. Anchor the Conversation Around Risk Avoidance
Workforce planning is often perceived as optimization.
In reality, it is risk mitigation.
The risks include:
- Unplanned attrition spikes
- Compensation inflation shocks
- Skill shortages
- Location saturation
- Over-hiring during demand misreads
The workforce management ROI calculator quantifies the financial exposure of those risks and shows how workforce intelligence reduces them.
Boards understand risk-adjusted return.
Frame the investment as:
- Reducing forecast volatility
- Improving cost predictability
- Protecting margin under labor market uncertainty
Now the discussion shifts from “Why spend on workforce intelligence?” to “What is our exposure if we do not?”
5. Position Workforce Intelligence as Data Infrastructure
CFOs approve infrastructure investments more readily than programmatic experiments.
Workforce intelligence should be positioned alongside:
- Financial forecasting systems
- Sales pipeline analytics
- Supply chain visibility tools
It is not a reporting layer. It is an input layer.
The workforce management ROI calculator becomes the output layer that translates workforce intelligence into financial terms.
Once the board understands that workforce planning precision directly affects cost optimization, hiring velocity, and margin protection, the conversation changes tone.
It stops being about HR transformation.
It becomes about operational resilience.
How to Use a Workforce Management ROI Calculator in Your Actual Planning Cycle
This is where theory usually dies.
Many organizations build a workforce ROI calculator once, use it for a funding request, and then forget about it until next year’s budget cycle.
That defeats the purpose.
A workforce management ROI calculator should sit inside three recurring decision moments: annual planning, quarterly recalibration, and mid-year risk reviews.
Here’s how it works in practice.
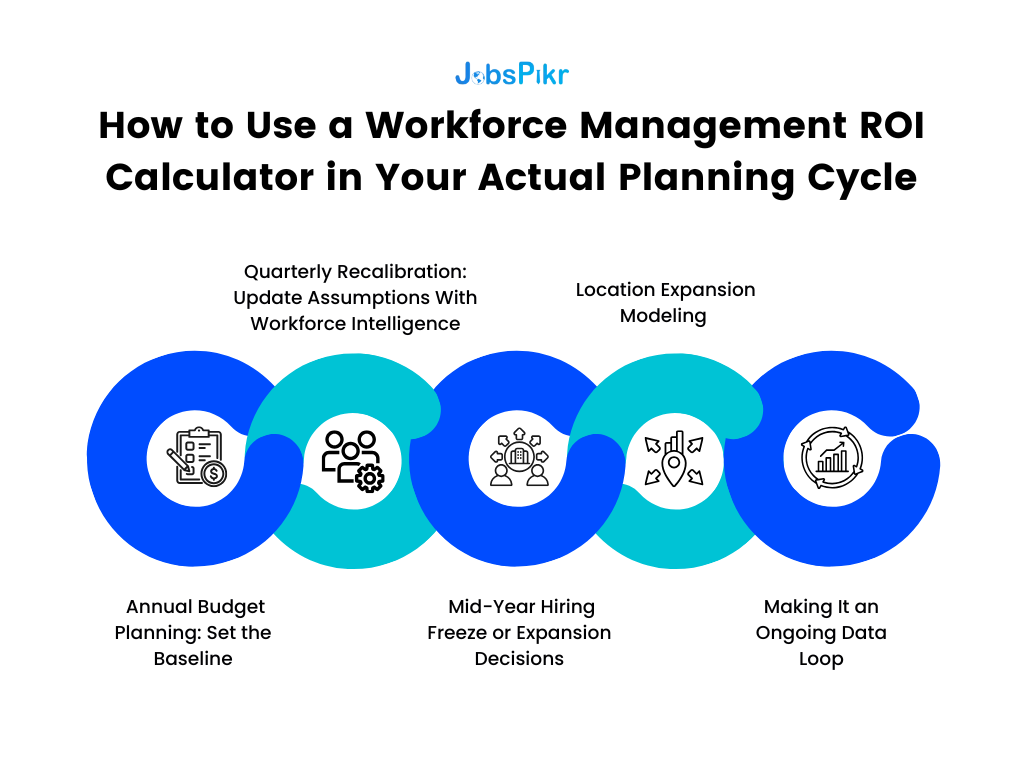
1. Annual Budget Planning: Set the Baseline
During annual workforce planning, most organizations lock in:
- Headcount growth targets
- Hiring volume
- Compensation budgets
- Attrition assumptions
This is where the workforce management ROI calculator sets its baseline.
You input:
- Total headcount
- Planned attrition rate
- Expected hiring volume
- Average salary and fully loaded cost
- Current average time-to-fill
- Urgent hiring percentage
The calculator then produces your baseline exposure:
- Attrition variance sensitivity
- Vacancy cost exposure
- Compensation premium risk
- Overstaffing downside
Instead of approving a headcount plan in isolation, leadership sees the financial volatility band tied to it.
This is where workforce planning shifts from capacity discussion to cost optimization modeling.
2. Quarterly Recalibration: Update Assumptions With Workforce Intelligence
Labor markets move faster than annual cycles.
Quarterly, the workforce management ROI calculator should be updated with:
- Revised attrition actuals
- Time-to-fill trends
- Compensation market shifts
- External hiring demand signals
For example:
If attrition in Q1 trends 1% higher than expected, you do not wait until year-end to assess impact.
You update:
- Projected annual attrition
- Replacement exposure
- Backfill volume
Then recalculate variance cost immediately.
This is how hr analytics roi becomes continuous, not retrospective.
3. Mid-Year Hiring Freeze or Expansion Decisions
Most enterprises face at least one mid-year correction.
Either growth accelerates and hiring expands. Or macro conditions tighten and hiring freezes.
The workforce management ROI calculator supports both.
If expansion is considered:
You model increased hiring volume against market competition risk and time-to-fill sensitivity.
If a freeze is considered:
You model overstaffing correction vs. future backfill surge risk.
For example:
Freezing 100 planned hires might reduce payroll short term.
But if demand rebounds and urgent hiring spikes later, the model can show:
- Potential premium cost
- Time-to-fill extension impact
- Revenue delay exposure
This prevents reactive swings.
4. Location Expansion Modeling
When evaluating a new delivery center or regional expansion, workforce intelligence feeds directly into the workforce roi calculator.
Inputs include:
- Regional compensation benchmarks
- Hiring velocity
- Talent supply saturation
- Competing employer intensity
The model compares:
Scenario A: Hire 200 roles in primary metro
Scenario B: Split across secondary markets
You calculate:
- Compensation delta
- Time-to-fill delta
- Attrition risk differential
Now location decisions become financially modeled, not intuition-driven.
5. Making It an Ongoing Data Loop
The most important shift is structural.
A workforce management ROI calculator should not live in a static spreadsheet owned by HR.
It should:
- Pull updated workforce intelligence inputs regularly
- Recalculate forecast variance dynamically
- Feed outputs into finance forecasting models
When this loop exists, workforce planning becomes part of enterprise data infrastructure.
Not a slide deck. Not a one-time business case.
A living model that adjusts as labor conditions change.
And this is where JobsPikr becomes operationally relevant.
JobsPikr supplies the workforce intelligence layer, job demand signals, compensation trends, skill velocity, geographic hiring patterns.
The workforce management ROI calculator translates those signals into financial impact.
Together, they transform workforce planning from a compliance exercise into a measurable performance lever.
Smarter Workforce Planning Is Measurable, Not Aspirational
For years, workforce planning has been framed as a matter of strategic alignment. The language sounds right. The intent is valid. But when budgets tighten, strategy without numbers rarely survives.
A workforce management ROI calculator changes that dynamic.
It forces one uncomfortable but necessary question: what is the financial cost of forecast error?
- Not what is the cost of hiring.
- Not what is the cost of payroll.
- But what is the cost of being wrong.
If attrition forecasts are off by 1–2 percentage points, that variance has a replacement cost. If hiring demand is misread, there is either overstaffing drag or vacancy revenue leakage. If compensation bands lag market shifts, there is either premium hiring cost or preventable churn.
These are not HR problems. They are having operating margin problems.
The workforce management ROI calculator is not another analytics layer. It is a financial control system for workforce planning accuracy.
When you model vacancy duration, attrition variance, compensation drift, and skill mismatch inside a workforce management ROI calculator, you convert workforce planning into a financial control system.
That is the shift.
- Instead of arguing for better analytics, you demonstrate reduced volatility.
- Instead of presenting dashboards, you present deltas.
- Instead of asking for belief, you show modeled exposure.
This is where workforce intelligence becomes infrastructure. It feeds the model continuously so that assumptions are not frozen in time. And when assumptions stay current, the workforce roi calculator stops being a budgeting aid and becomes a planning engine.
For HR leaders, this provides leverage. For finance partners, it provides predictability. For boards, it provides risk containment.
The organizations that treat workforce planning as measurable variance reduction will always outpace those treating it as administrative forecasting.
The math is not complicated. The discipline is.
Organizations that operationalize a workforce management ROI calculator alongside real-time workforce intelligence gain predictability in an environment where labor volatility is the norm.
Make Workforce Planning Defensible at the CFO Level
Discover how JobsPikr feeds your workforce management ROI calculator with real-time workforce intelligence.
FAQs
1. What is a workforce management ROI calculator?
Think of it as a pressure test for your workforce plan.
Most teams build headcount plans and assume things will land close to forecast. A workforce management ROI calculator asks, “What happens financially if we’re off?” It models the cost of vacancies running longer than expected, attrition coming in higher than planned, or compensation offers creeping above band.
It’s not another HR dashboard. It’s a way to put a dollar value on planning accuracy.
2. How does HR analytics ROI connect to financial performance?
HR analytics ROI only becomes real when you move past metrics and into money.
Reducing time-to-fill sounds good. But what does ten days faster actually mean in dollars? Lower attrition sounds positive. But how much replacement cost did that avoid?
When you tie workforce metrics to revenue per employee, replacement cost, or fully loaded payroll, finance starts paying attention. That’s where hr analytics ROI shifts from reporting improvement to protecting margin.
3. What inputs are required for a workforce ROI calculator?
You don’t need a complex model to start. You need honest numbers.
Total headcount. Hiring volume. Planned attrition. Average salary. Fully loaded cost per employee. Current time-to-fill. Percentage of urgent hires.
Then you layer in workforce intelligence if you have it — things like compensation movement in the market or rising demand for specific skills. The more realistic the inputs, the more credible the output.
The calculator doesn’t need to be perfect. It needs to reflect how your organization hires and loses people.
4. How does workforce intelligence improve cost optimization?
Without workforce intelligence, you’re planning based on what already happened.
With it, you start seeing pressure build before it hits internally. If a role’s demand is climbing across the market, you can anticipate longer hiring cycles or compensation movement. If hiring activity slows in a region, you may gain speed or cost advantage.
That foresight reduces urgent hiring, surprise attrition, and overcorrections. And those are the exact places where cost tends to leak.
5. Can a workforce management ROI calculator support board-level decision making?
It can, if you present it the right way.
Boards don’t want HR metrics. They want risk clarity. If you show that a 1% shift in attrition equals a multi-million-dollar exposure, or that forecast variance is creating unstable payroll swings, the conversation changes.
The workforce management ROI calculator works at board level when it shows volatility reduction, not operational efficiency. That framing makes it easier to treat workforce planning as infrastructure instead of overhead.